Cardano: Assessing the odds of a reversal ahead

Disclaimer: The findings of the following analysis are the sole opinions of the writer and should not be considered investment advice
Since earning its lifetime milestone on 2 September, Cardano (ADA) has been on a steep descent that practically moved it below all its EMA ribbons. Over the last 19 days, ADA has formed a bearish flag on its daily chart while the 20 EMA stood sturdy.
From here on, slightly weak readings on its technical indicators coupled with the bearish flag pattern have positioned ADA for a possible retest of the lower trendline of the flag in the days to come.
At press time, ADA was trading at $1.13, down by 3.38% over the last 24 hours.
ADA Daily Chart

Since its ATH, ADA has formed a five-month-long falling wedge (reversal pattern, white) while the alt was on a sharp downtrend. Further, it lost over 44% of its value in just three days as it plunged to hit its nine-month low on 22 January. Consequently, it formed a bearish flag and pole while flipping the vital $1.2-mark from support to resistance.
It becomes crucial to note that the $1.12-level support has stood as a testing floor for over 11 months. As a result, for the past two weeks, the bulls have been exerting pressure to reclaim the $1.2-level. But, they still struggled to topple the 20 EMA.
Now, the $1.123-mark becomes a critical point for the buyers to step in to prevent a further pullback. But, any close below its immediate support would propel a test of the $1.01-mark support before a possible reversal from the falling wedge pattern. Should the bears dwindle, the bulls could initiate an attempt to recover the $1.2-mark. But that would most likely be short-lived until the bulls ramp up trend-altering volumes.
Rationale
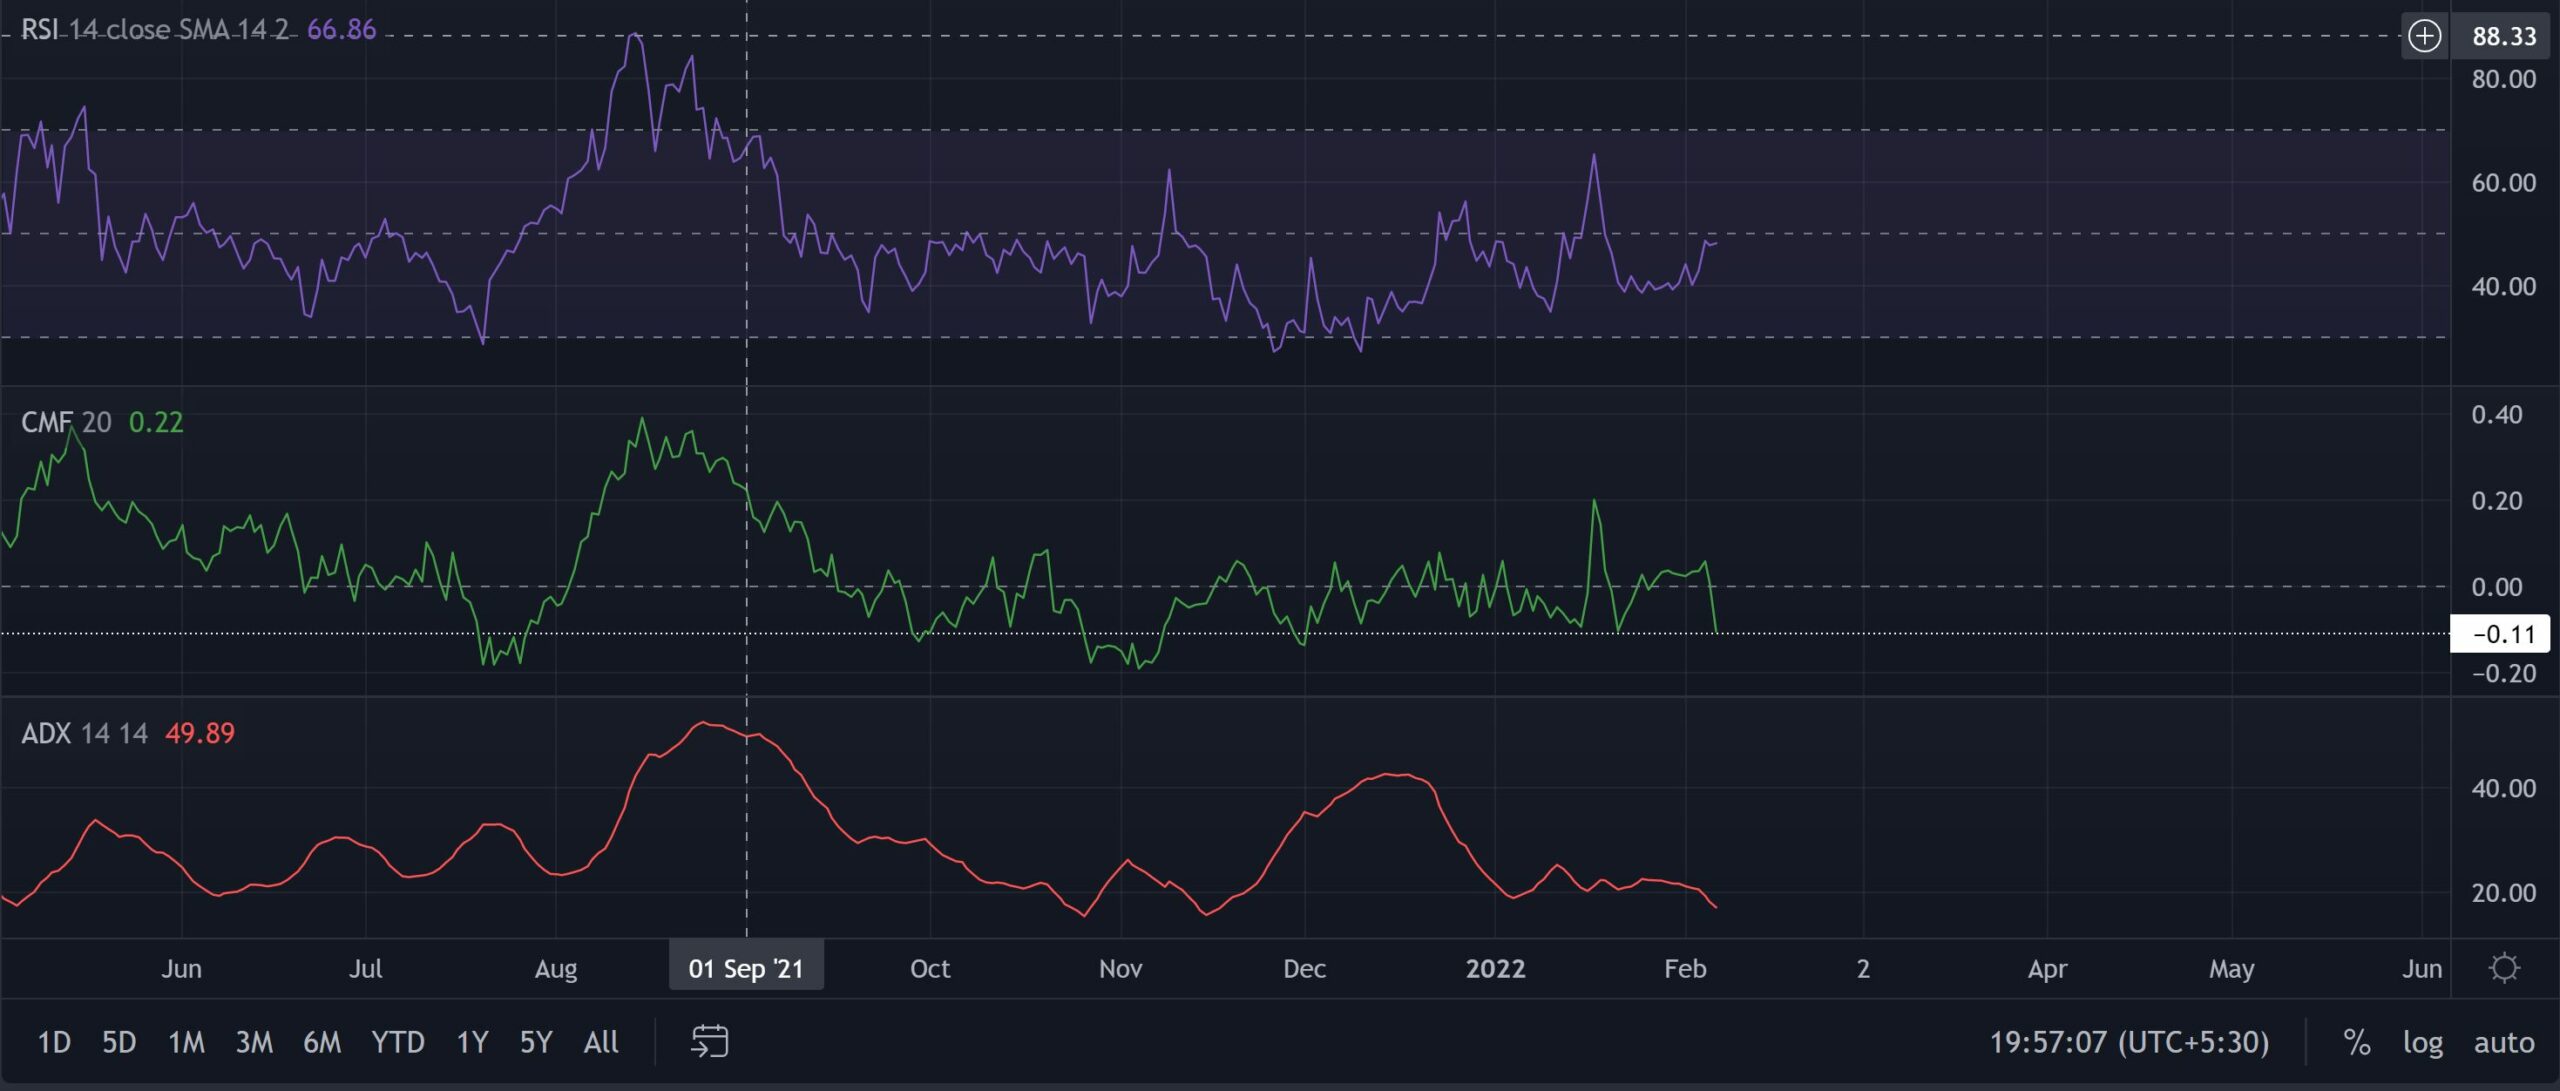
Although the RSI has been on an uptrend, it still needs to overturn its midline on the daily chart to affirm a bullish edge. Now, one must closely watch out for a break outside the existing flag range to ensure a prudent trading call/short.
The CMF steeply plunged below the zero-line, depicting a bearish bias in the near term. Nevertheless, the alt revealed readings on its ADX (directional trend) at the time of writing.
Conclusion
Although the indicators are flashing mixed signs, the bulls still lack volumes to counter the broader downtrend. Thus, a possible retest of the $1.01 or $0.8-mark before a strong reversal should not be of surprise.
Even so, traders/investors should keep a close eye on Bitcoin’s movement as ADA shares a 76% 30-Day correlation with the king coin. Further, they should also watch out for the on-chain metrics affecting the current and the potential perception of ADA’s value.