Cardano, Binance Coin, The Sandbox Price Analysis: 17 December

As Bitcoin entered the $46,000-mark, the corresponding effects were witnessed in most altcoins as they struggled to counter the bearish force. As a result, Cardano, Binance Coin, and the Sandbox were trading in the red zone over the past day.
Cardano (ADA)

While most cryptos relished an Uptober, ADA lost nearly 60% of its value since its ATH on 2 September. After a 13.05% breakdown from the rising wedge, the price action steeply plunged to poke the $1.19-mark on 11 December.
Although the alt formed a descending triangle (yellow), the bulls retested the $1.26-mark (20-week resistance) four times before initiating a breakout. This push came alongside the news of the development of Cardano’s layer-2 scaling solution (Hydra).
However, at press time, ADA traded at $1.227 after noting a 5.49% 24-hour loss. Now, the price action found immediate testing support at the $1.2-mark.
The RSI exhibited a bearish inclination and seemed to head south. Further, the DMI and MACD implied a seller’s market but flashed a weak directional trend. The recent bearish move pushed the price above the 20-50-200 SMA.
Binance Coin (BNB)
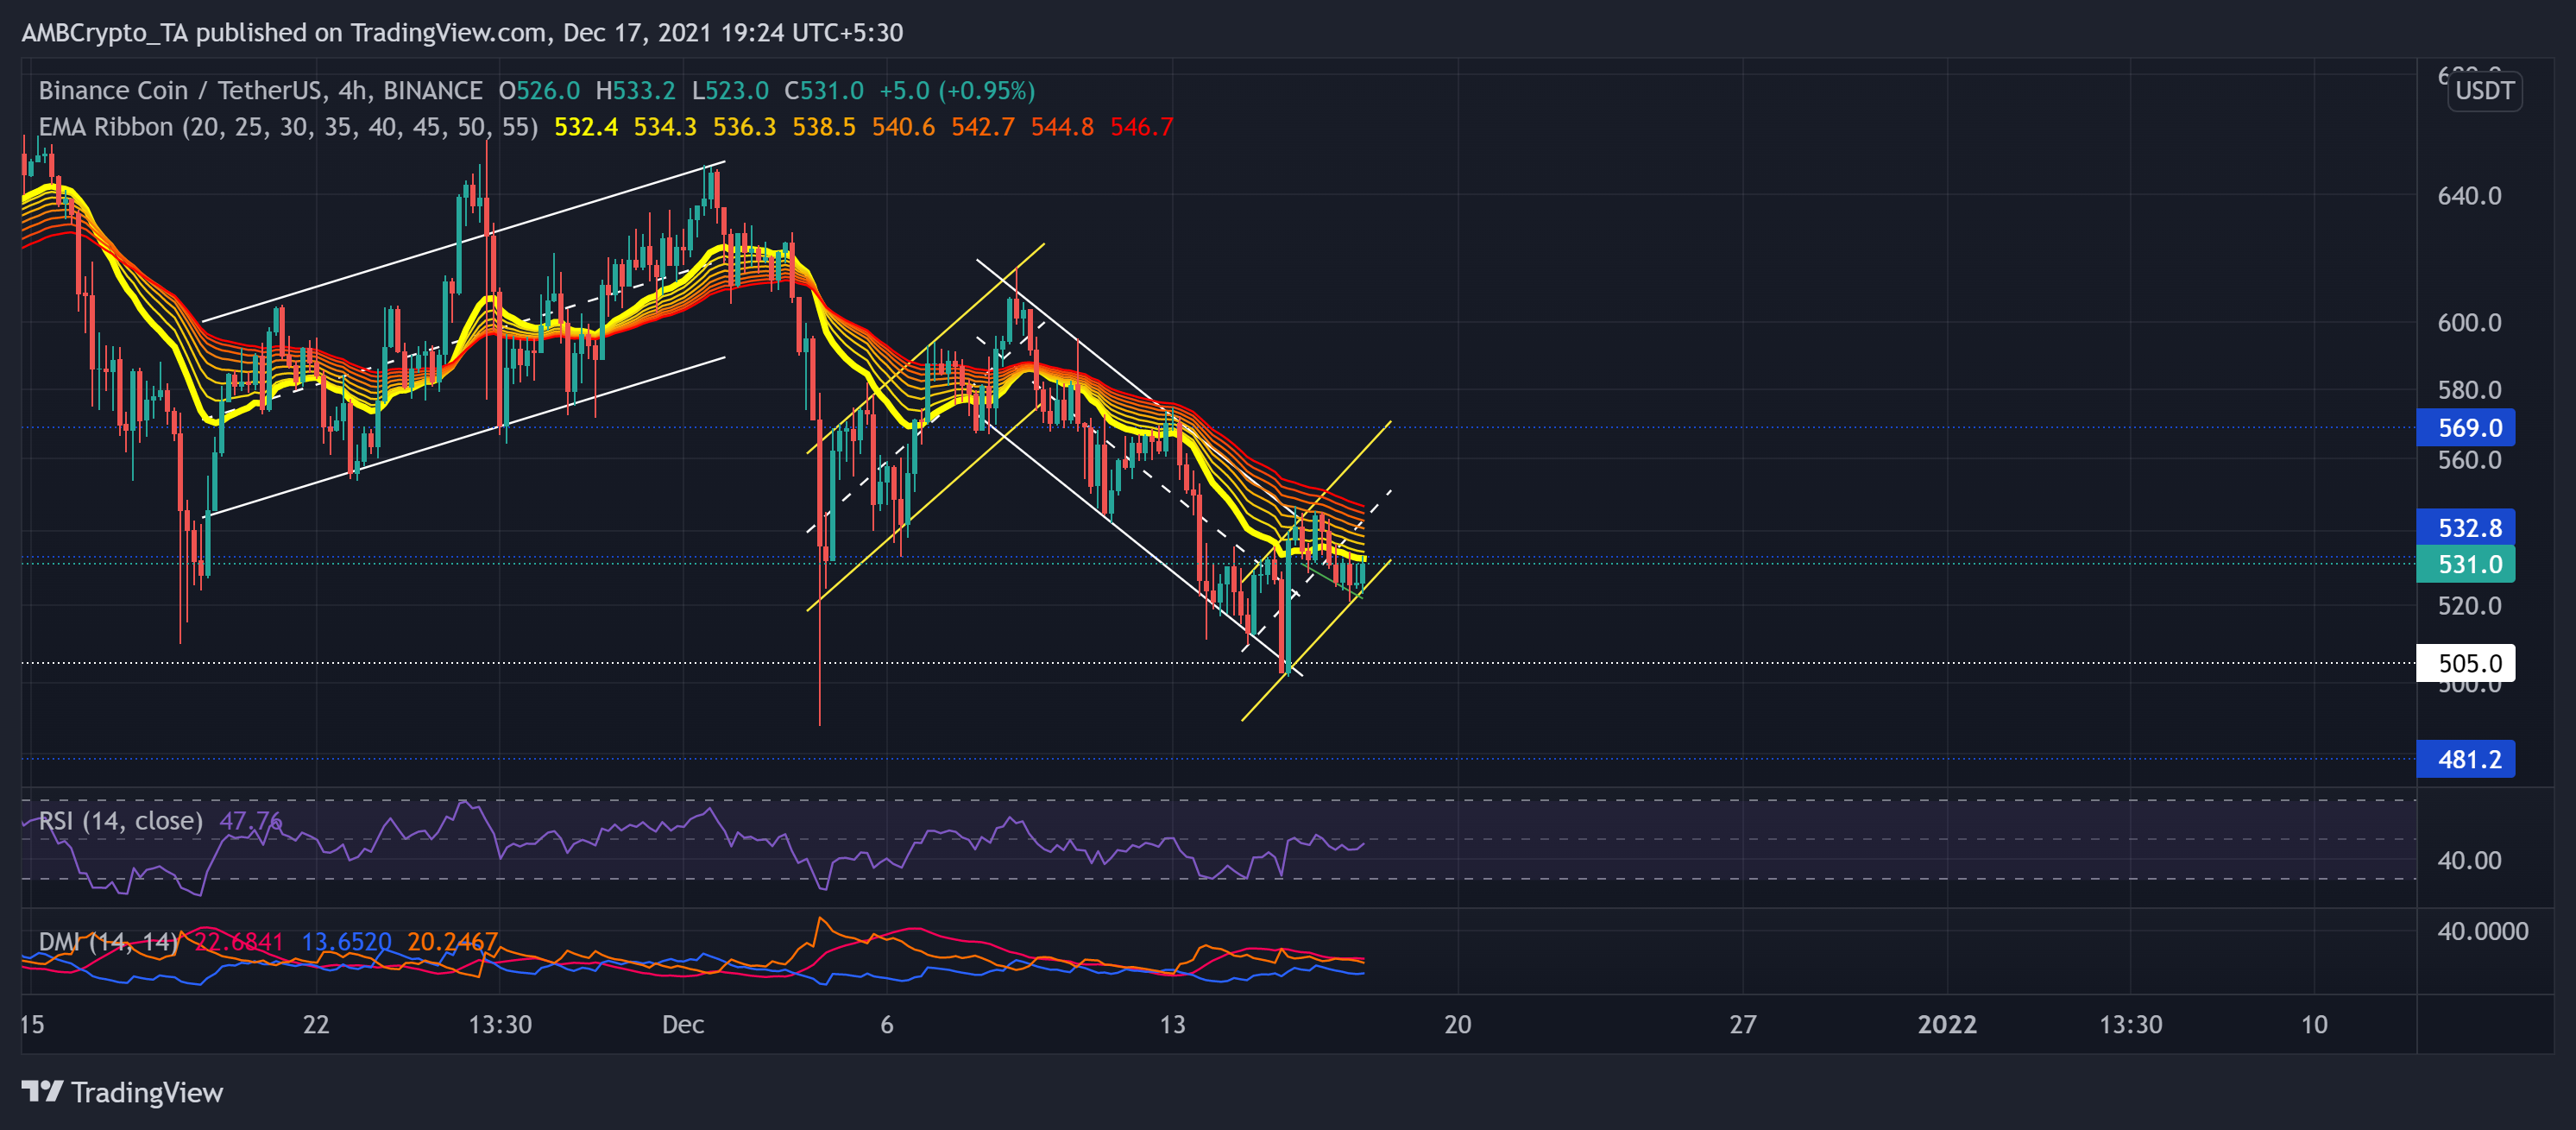
BNB formed a descending channel (white) after an up-channel breakdown on 9 December. As a result, the alt saw a 13.57% eight-day loss.
With this downfall, the bears pushed the price below its immediate resistance at the $532-mark. Over the past day, BNB bulls endeavored to test the above level twice but failed to surpass it. Now, the lower EMA ribbon (dark yellow) stood as an immediate hurdle for the alt to conquer.
At press time, BNB traded at $531. The RSI felt resistance near the midline for the past eight days. Keeping in mind the overall market sentiment, the bulls may find it difficult to trigger a sustained rally above the $569-mark. Moreover, the DMI lines flashed a bearish bias while the ADX displayed a weak directional trend.
The Sandbox (SAND)
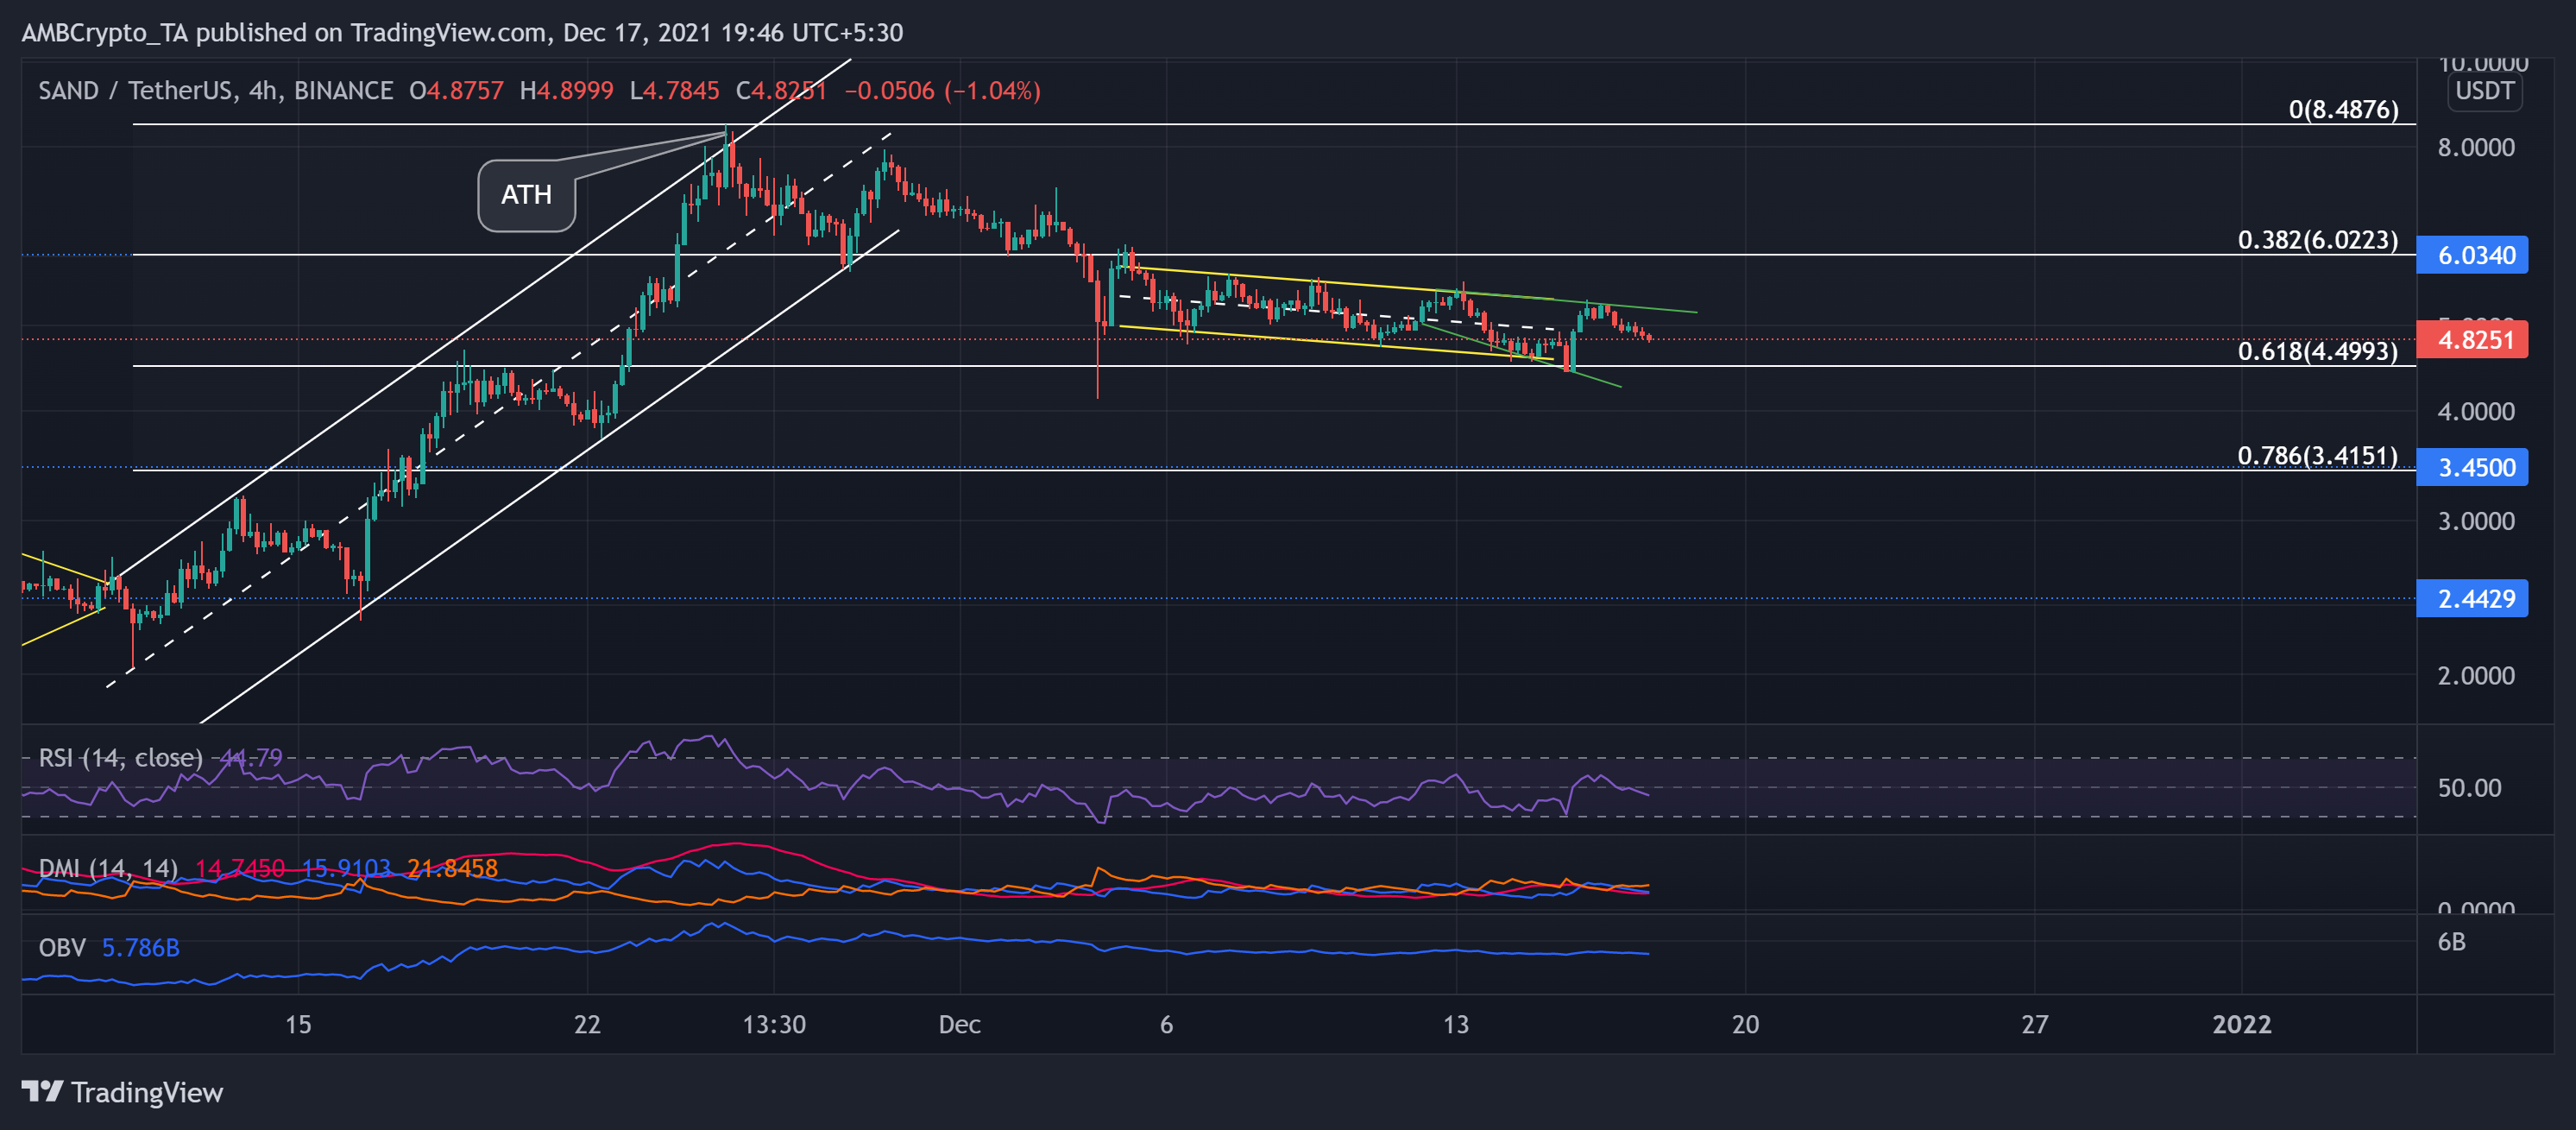
Since its ATH on 25 November, the alt has steadily declined. The bears retested the $6.03-mark twice before a further downturn. Over the past few days, it moved in a down-channel (yellow) and seemed to find support at the golden 61.8% Fibonacci level.
At press time, the alt traded at $4.8251 after noting a 7.7% 24-hour loss. The RSI dipped below the midline and showed slackening signs.
Further, the DMI displayed a bearish bias. But the ADX depicted a weak directional trend. Regardless of the bearish tendencies, the OBV did not seem to suggest a sharp decrease in buying pressure.