Cardano broke out of a falling wedge; the results have been…?

Disclaimer: The findings of the following analysis are the sole opinions of the writer and should not be considered investment advice
A large portion of the circulating Cardano supply is held by whales, and there was some evidence from an NVT spike that suggested that the token could be undervalued. ADA’s trading volume has also been rising as the price fell, which hints that the downtrend was backed by genuine selling pressure.
ADA- 1 Day Chart
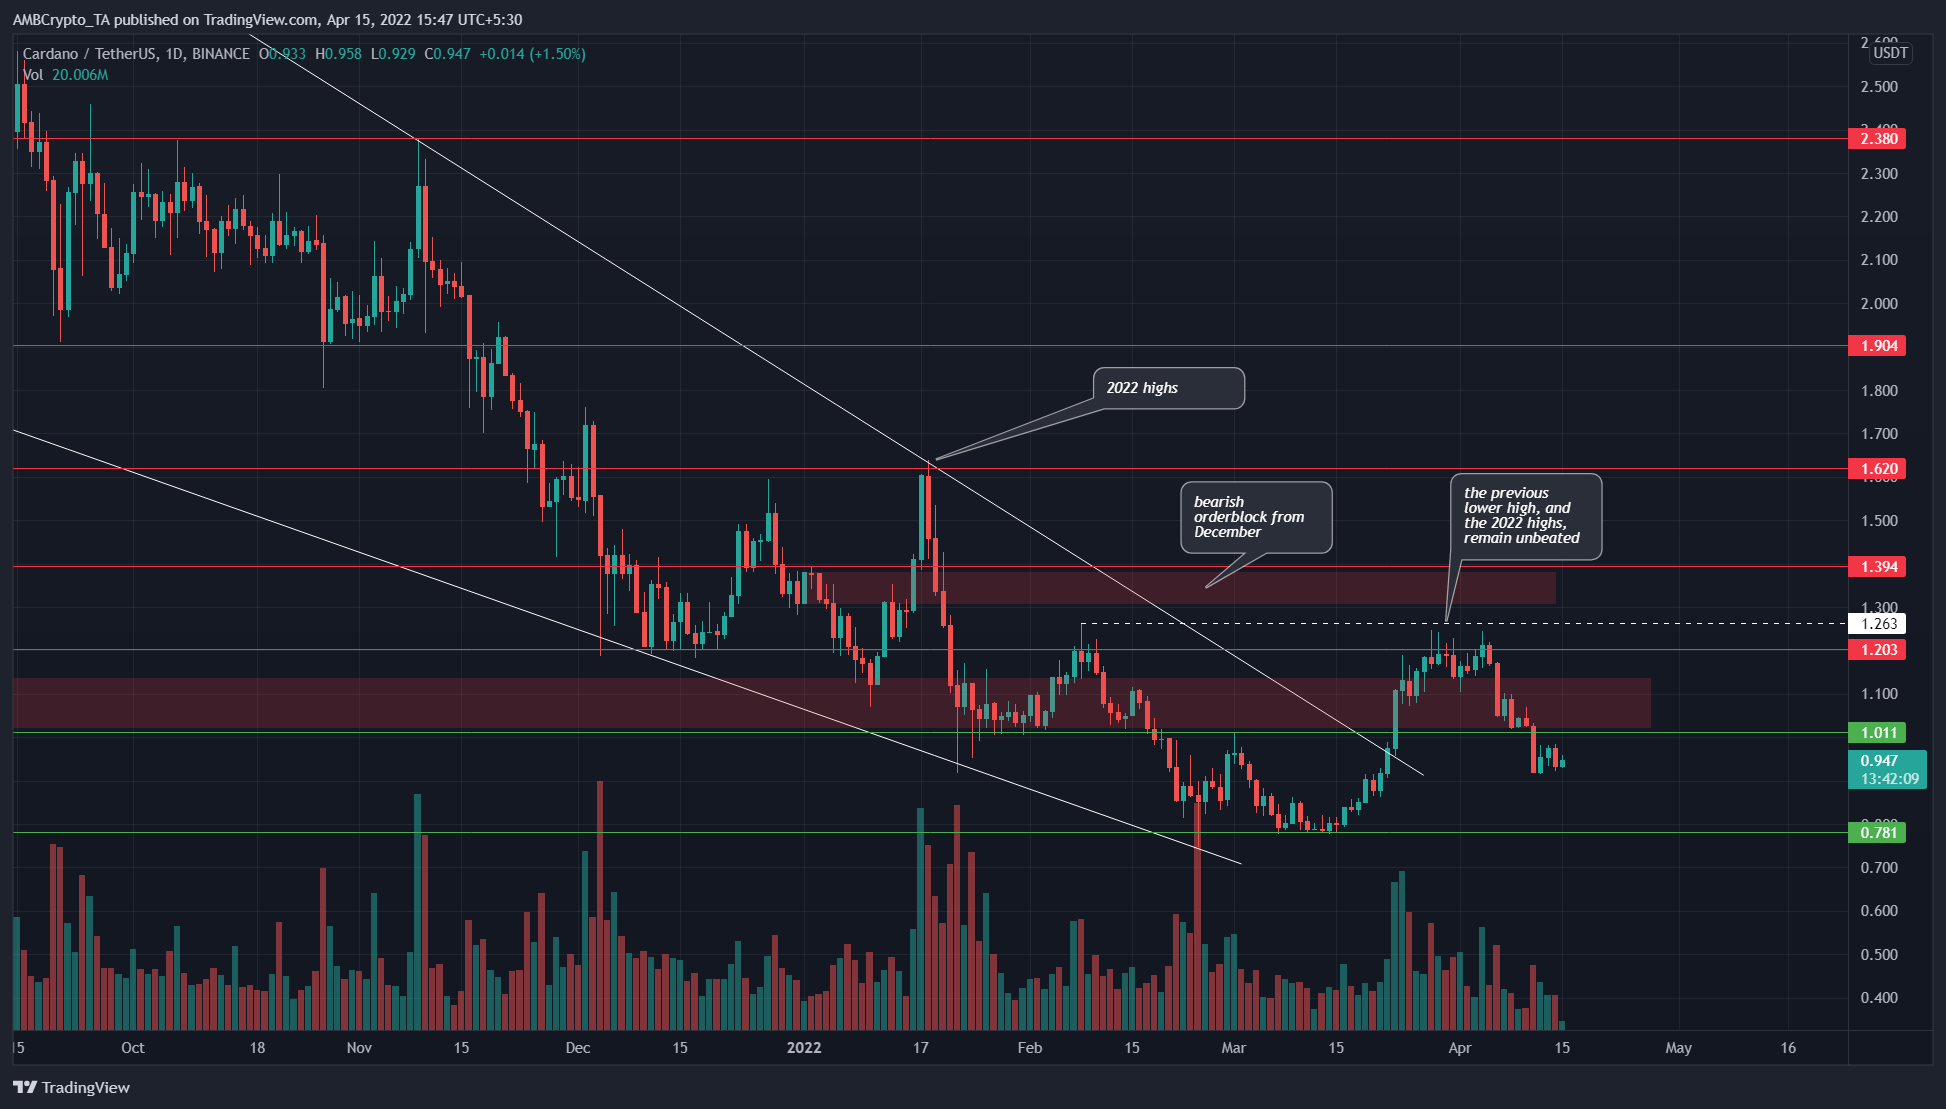
Cardano had formed a falling wedge (white) and, in mid-March, saw a breakout from the chart pattern. This breakout was a bullish development, but it ran into a block of sell orders at the $1.2 mark.
Moreover, when within the wedge and the downtrend, the price registered a lower high at $1.26, which is also the high of the year 2022. On the breakout from the wedge pattern, ADA was unable to clear this level.
In the past few days, strong selling pressure forced ADA prices back beneath the technical and psychological support level at $1.
Rationale
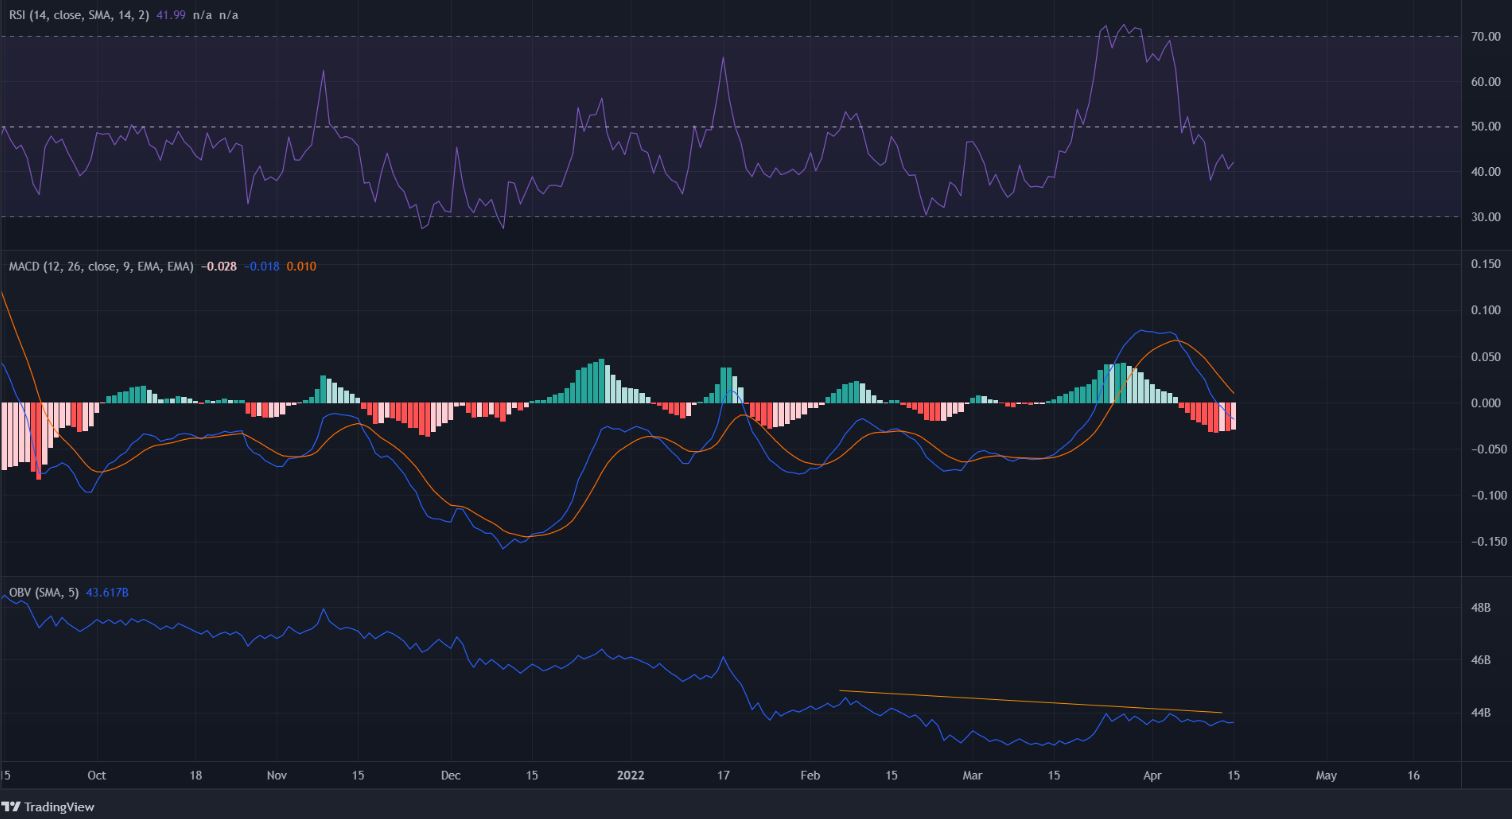
The RSI and the MACD showed strong bullish momentum when ADA initiated its breakout from the wedge, but the price eventually stalled at the $1.2 mark.
The momentum indicators also stalled and pulled back. At press time, the RSI dropped beneath neutral 50 to read 41.99 while the MACD also appeared to drop beneath the zero level. Both show strong bearish conditions.
The OBV has also formed a lower high on the attempted breakout, which meant buying volume has not been high enough to exhaust the sellers.
Conclusion
The momentum indicators on the daily chart took a turn toward the bearish side. The OBV also showed that buying volume was not strong enough to affect a breakout past the $1.2 area.
The price action was also bleak, as this could turn out to be a failed breakout from the wedge. Unless the $1.26 level is broken, the market structure would have a bearish bias to it.
The $0.78 level could be a buying opportunity, as there is a chance that ADA could form a range between $0.78-$1.22.


