Cardano, Chainlink, Tron Price Analysis: 10 December

While the ADA, LINK, and TRX bulls were able to claw back to their long-term support levels, the onus fell on the market leader to change the broader sentiment.
Besides, Chainlink managed to cross the 38.2% Fibonacci resistance with a recent bullish push, but its near-term technicals (like Cardano) flashed a bearish bias.
Cardano (ADA)

The alt diligently backtracked after touching its one-month high on 9 November. Consequently, ADA saw a 42.7% 30-day and 23.9% weekly decline in its value. As a result, the price action broke out below the 16-week resistance at the $1.4-mark.
After poking its 19-week low on 3 December, ADA marked a bearish rising wedge on its 4-hour chart. Over the past day, ADA saw an expected breakdown below the wedge. Thus, the price pulled back until its four-month-long support at the $1.28-mark. At press time, the alt traded at $1.303.
The RSI preferred the bears but showed some revival signs as the price bounced from the immediate support. Further, the DMI insisted on a bearish edge. Also, the OBV was on a steady decline since the last month, indicating decreased buying power.
Chainlink (LINK)
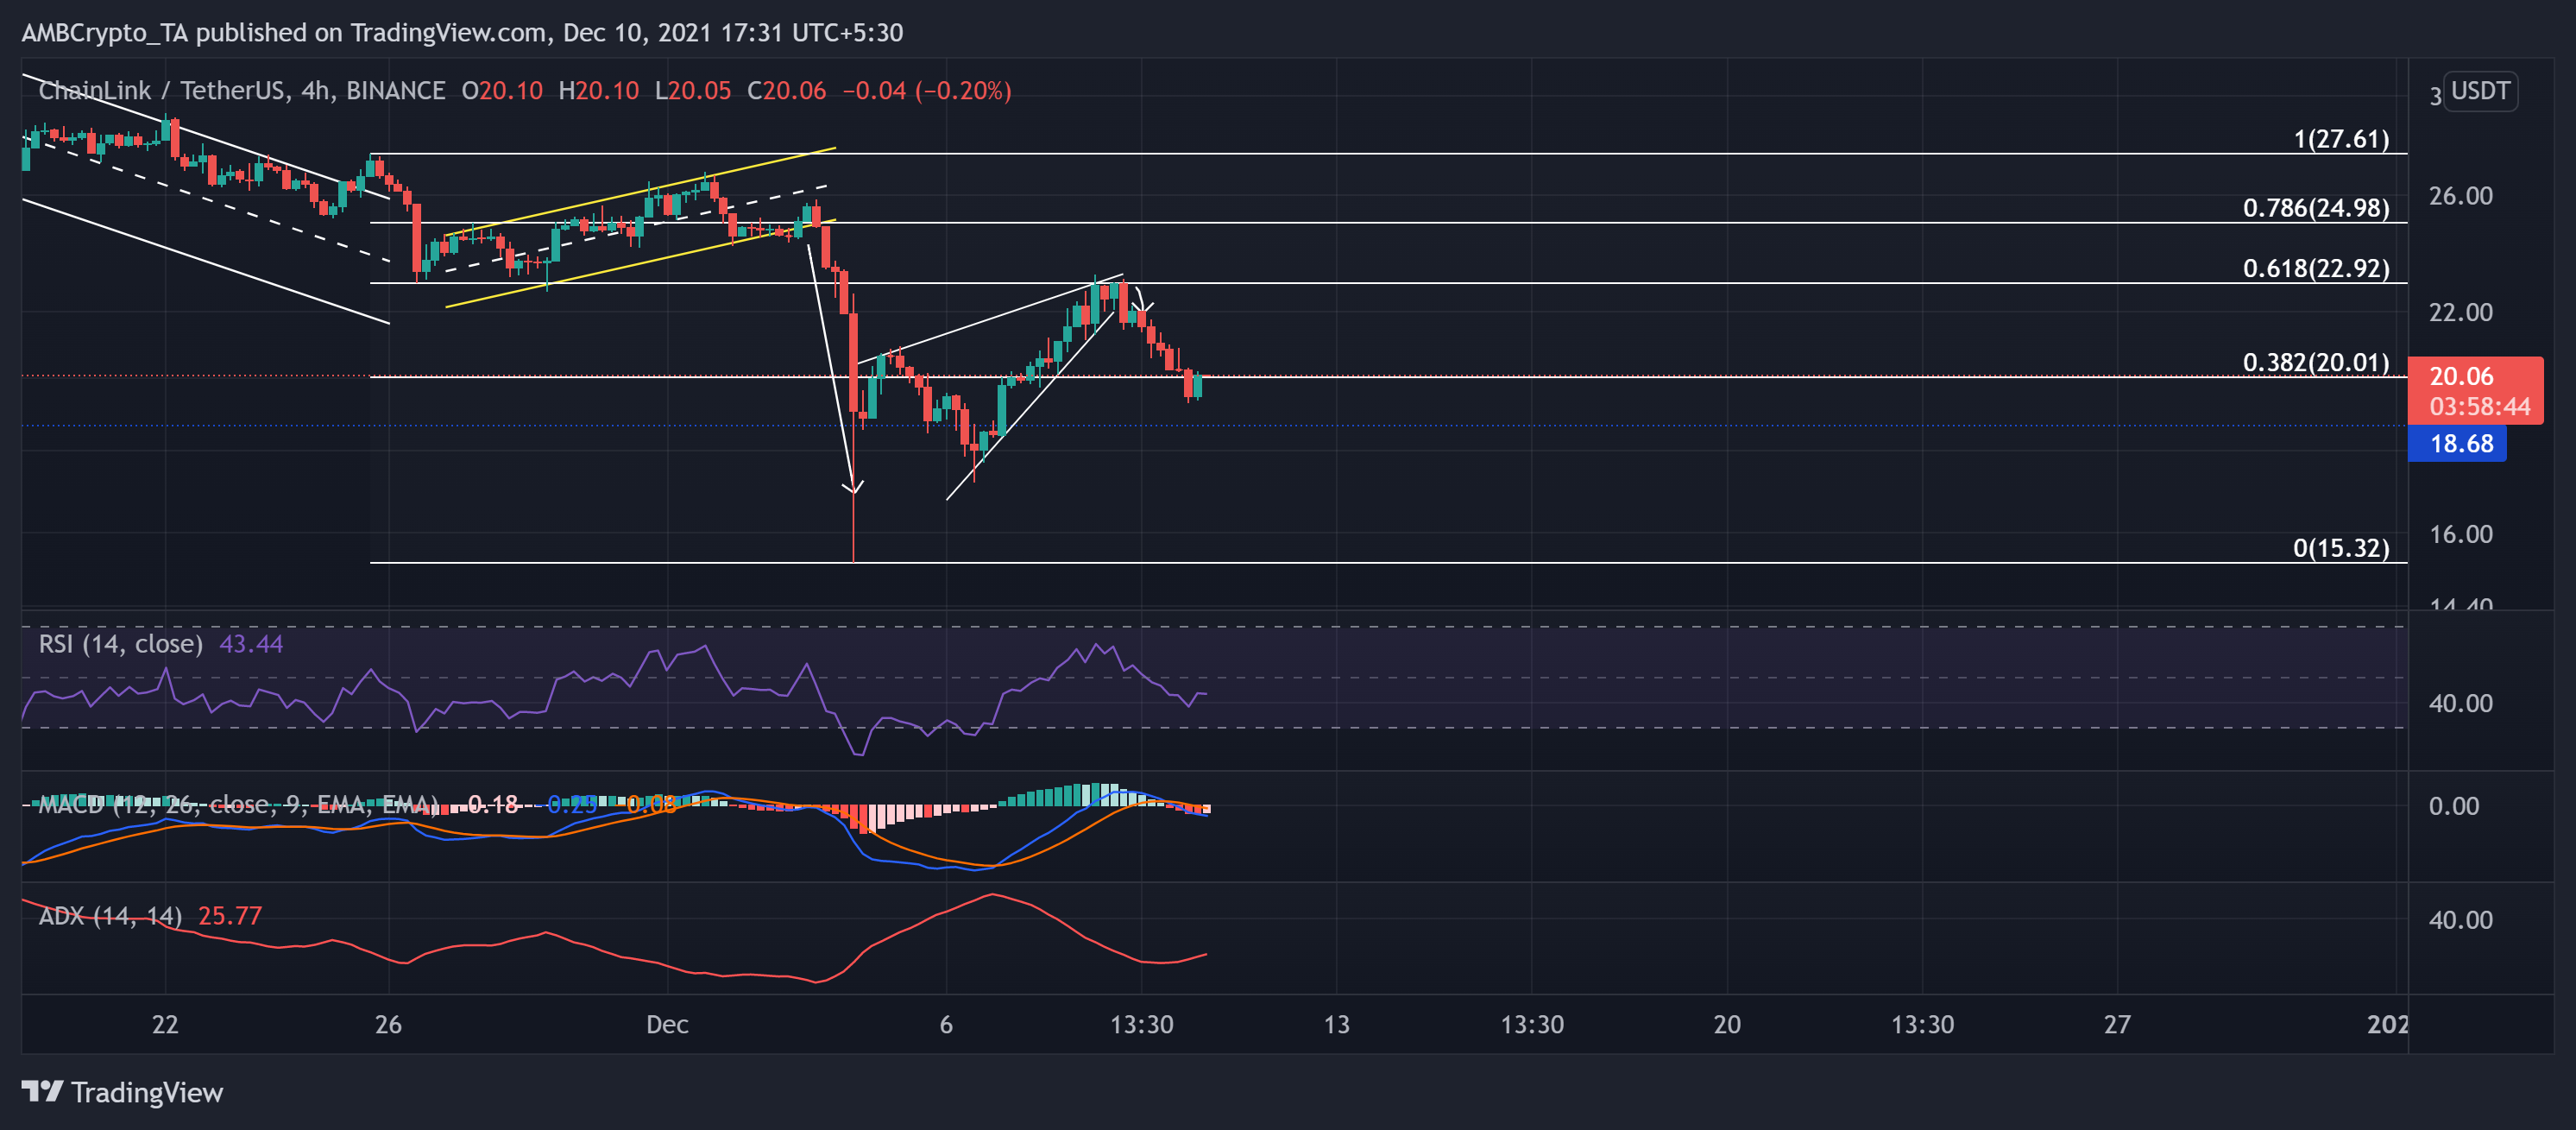
After an up-channel breakdown on 3 December, LINK bulls attempted a revival as the price action formed a rising wedge.
However, the alt undeniably saw strong resistance at the 61.8% golden Fibonacci level. Consequently, LINK saw a rising wedge breakout from the aforestated level as the trend reversed. The digital currency steadily fell after hitting its six-month high on 10 November. Although the bulls slackened, they breached the 38.2% Fibonacci resistance.
At press time, LINK traded at $20.06 after noting a nearly 7.2% 24-hour loss. The RSI swayed below the midline, hinting at a bearish preference. Further, the bearish MACD lines projected the near-term bearish push. But the ADX displayed a slightly weak directional trend. Now, the alt possibly looked at $22.92 as immediate resistance.
Tron (TRX)

TRX bears have shown resistance at the $0.118-mark for the last six months now. As a result, its price action saw a sharp plunge after poking its six-month high on 15 November. The alt fell in a descending channel (yellow) post an up-channel breakdown.
After a brief downfall, the bulls attempted a recovery. This movement formed a bearish double-top, after which the price slipped to touch its 16-week low on 3 December. Now, the bulls ensured the ten-week support at the $0.0899-mark.
At press time, TRX traded at $0.09208 after noting a 1.3% gain on its daily chart. The RSI moved sideways above the midline. Further, the DMI also depicted a marginal bullish preference, but the ADX displayed a weak directional trend.