Cardano: Despite interest in key area, why did ADA decline?

- Cardano’s volume climbed to over $500 million.
- ADA, however, remained in a strong bear trend.
According to data from Santiment, Cardano [ADA] was among the top-ranking cryptocurrencies on the 10th of June. This ranking placed ADA in second place, just behind Bitcoin [BTC].
AMBCrypto’s analysis of the ranking showed that ADA’s trends were almost evenly split between positive and negative sentiment.
Topics dominating the trend included smart contract NFTs, comparisons with Ethereum [ETH], and the growing decentralization of the network.
However, as of this writing, ADA was no longer among the top trending coins — it had fallen completely off the list. This implies that the discussion around ADA has significantly declined in the last 24 hours.
Cardano’s trends fall
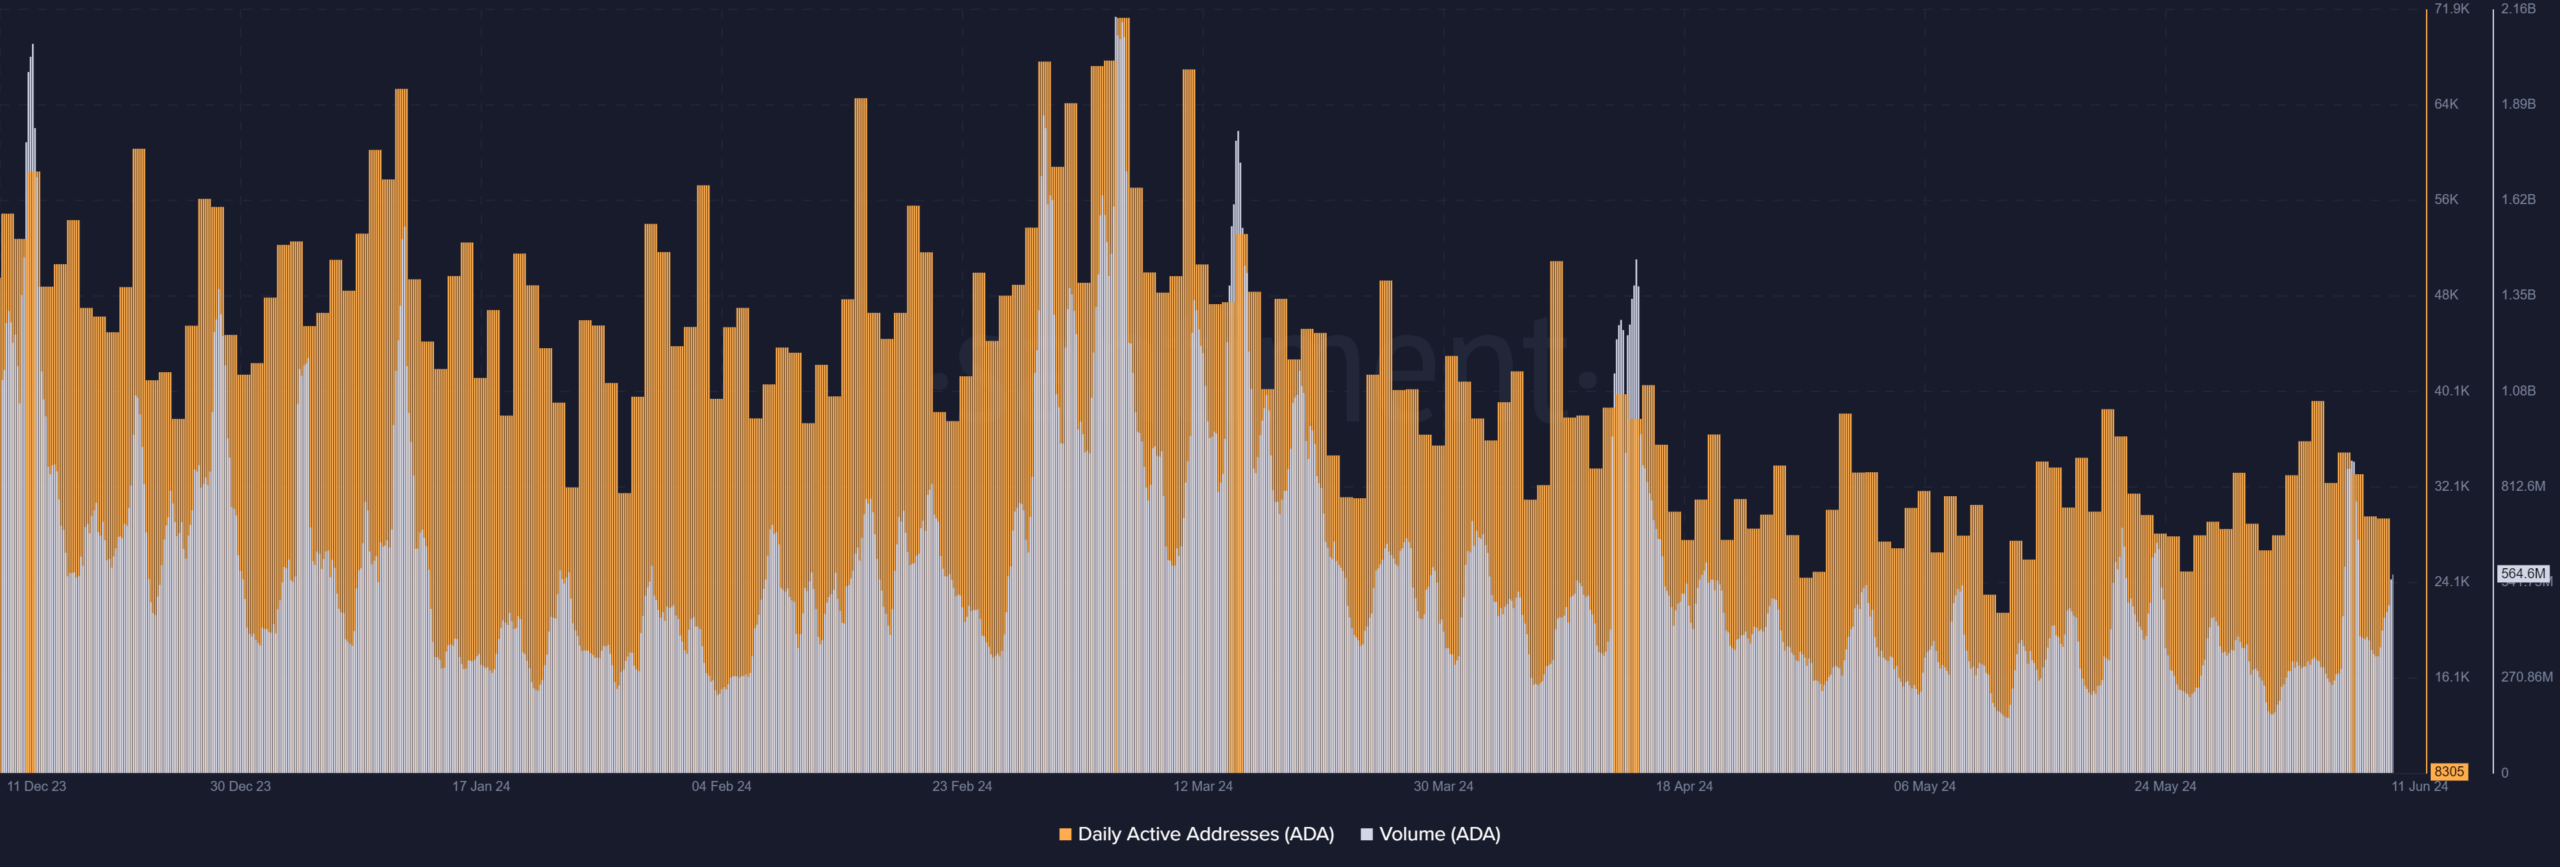
AMBCrypto’s analysis of Cardano’s daily active addresses metric on Santiment showed that it had been on a downtrend for the past few months.
Also, ADA’s number of active addresses had been declining since around March. During that time, the average number of active addresses was between 40,000 and 50,000.
The highest number of active addresses Cardano saw in May was around 39,000. As of this writing, the number of active addresses has dropped significantly to around 6,400.
The volume was the only metric that showed a slightly significant move in the last 24 hours. AMBCrypto’s look of the chart indicated that the volume was around $450 million at the close of trade on the 10th of June.
As of this writing, the volume has increased to over $550 million. However, analysis also revealed that sellers are now dominating the volume.
ADA declines again
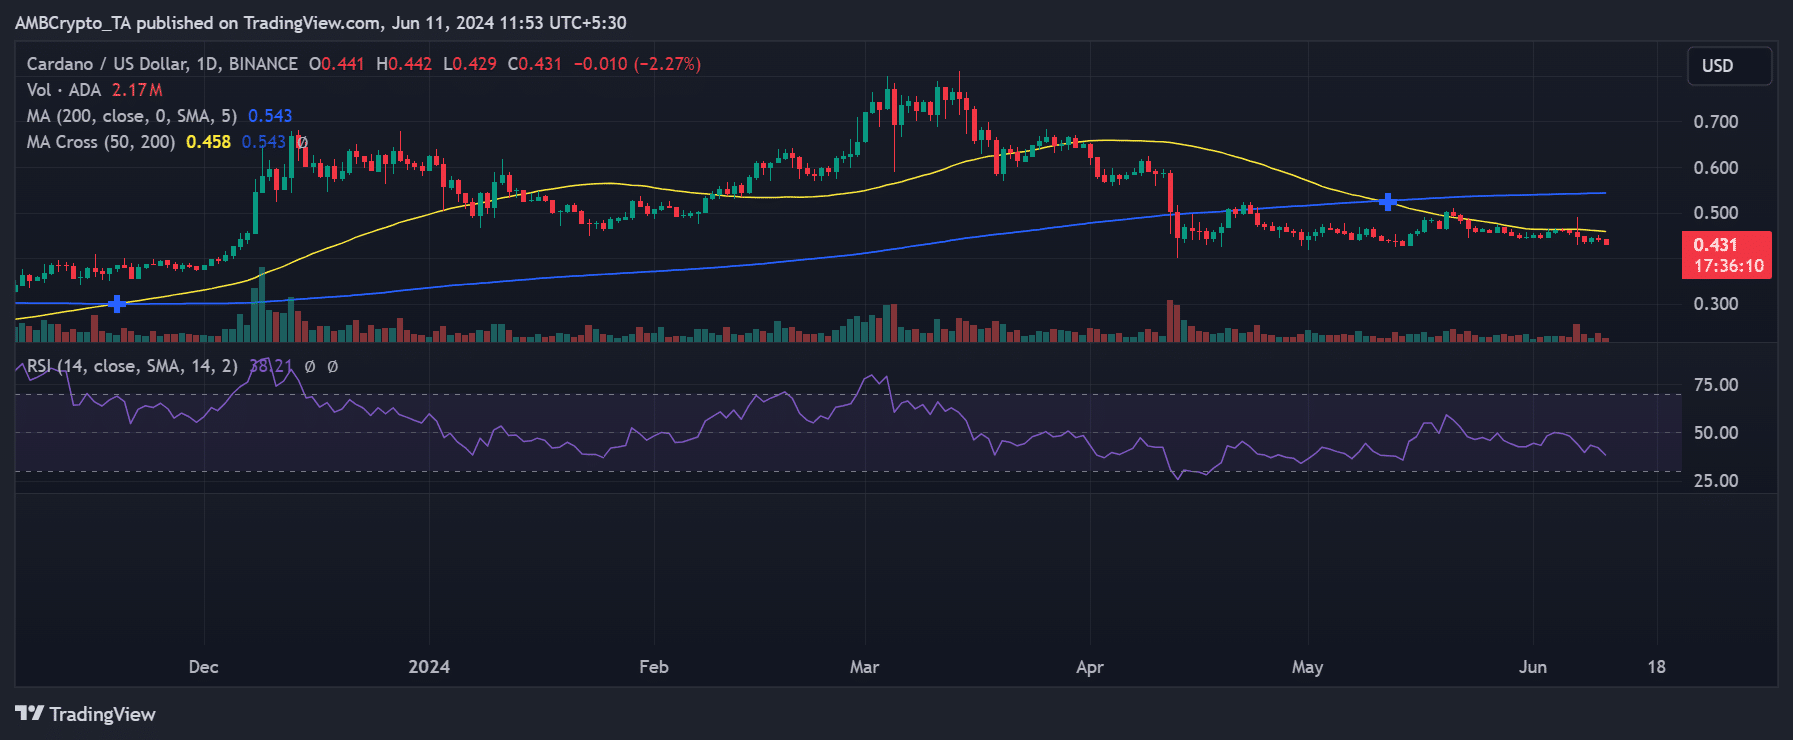
AMBCrypto’s analysis of ADA’s price trend on a daily time frame chart showed that it ended the trading session on the 10th of June with a decline.
The chart indicated a drop of approximately 0.68%, with ADA trading at around $0.444.
Is your portfolio green? Check out the ADA Profit Calculator
As of this writing, the decline has continued, with ADA now trading at around $0.43, marking a further decline of over 2%.
Its short moving average (yellow line) still served as resistance around the $0.46 price range. Additionally, the bear trend remained strong, as the Relative Strength Index (RSI) was below 40 as of this writing.


