Cardano, EOS, Synthetix Price Analysis: 07 March

Cardano moved deeper into the red zone but the bulls held on to the crucial 61.8% Fibonacci retracement level. EOS presented an added upside from the $4 mark but needed to break out from its tight channel. Lastly, SNX could face an uphill battle to rise above its 200-SMA on muted trading volumes.
Cardano [ADA]
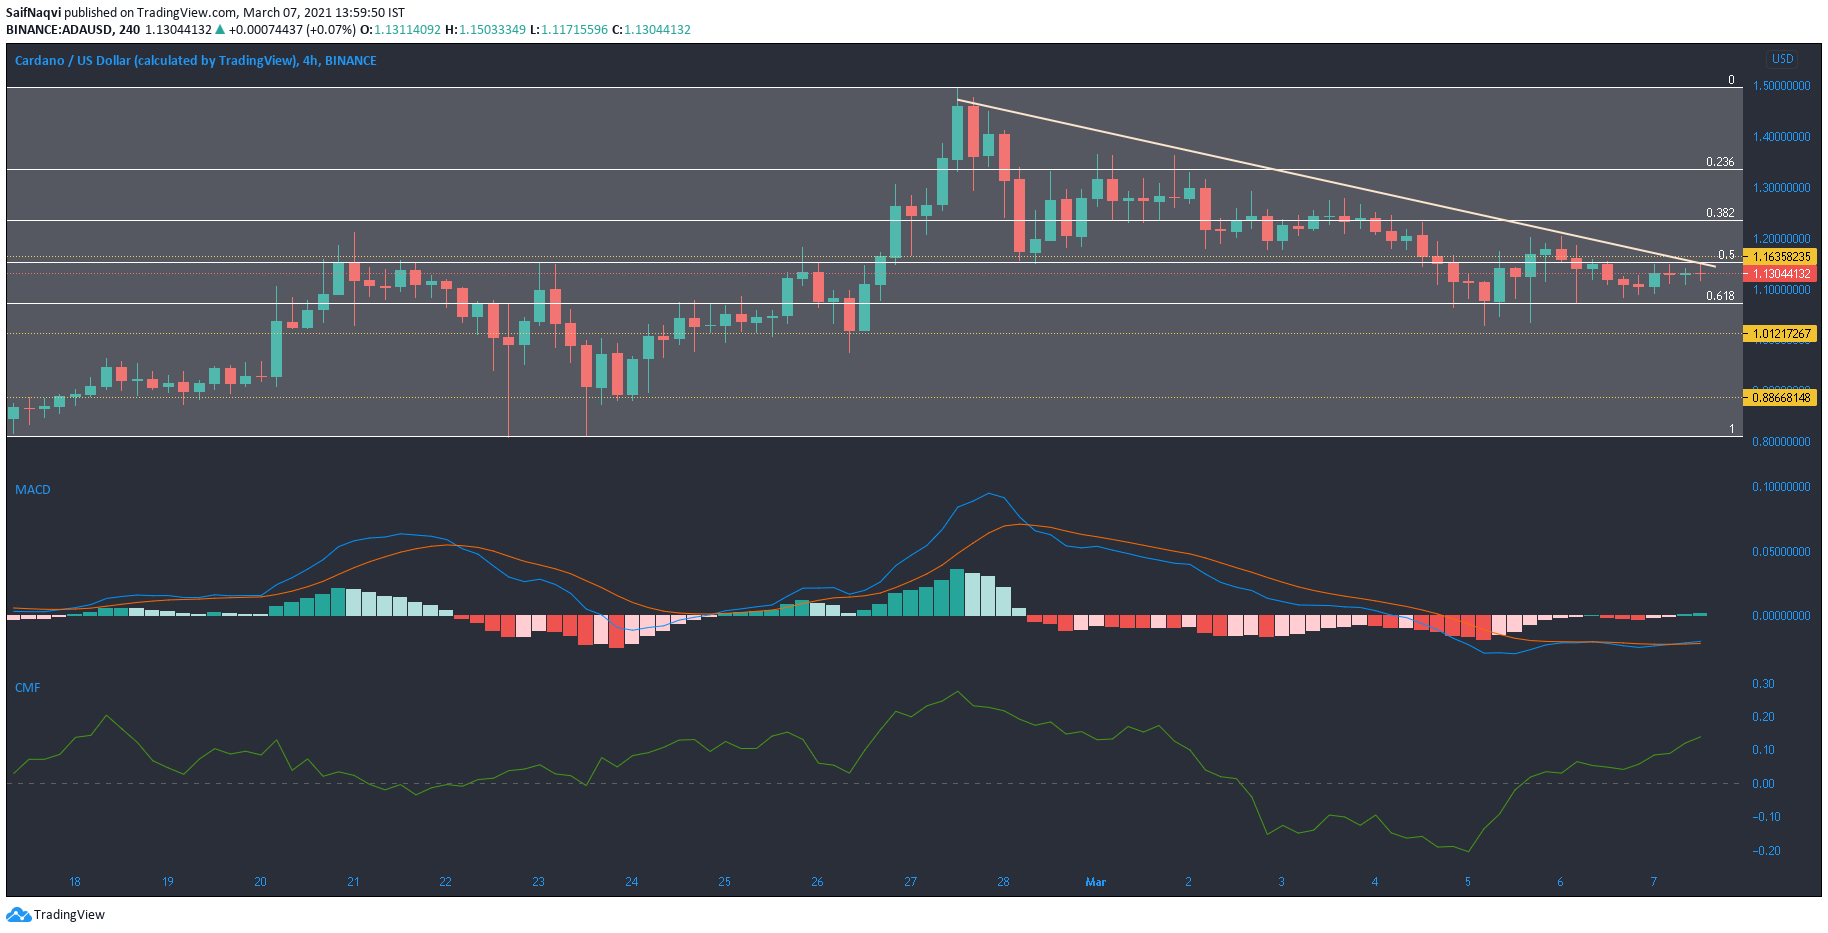
Cardano traded in the red territory at press time as a sell-off phase continued post its ATH over a week ago. In fact, losses of over 5% made ADA the biggest weekly loser among the top 10 coins by market cap. Recent losses also dethroned ADA from the third spot in the crypto rankings. The downtrend was evident on the 4-hour timeframe as the bulls conceded multiple Fibonacci retracement levels to the sellers, the latest one being the 50% level. However, the bulls still held on to the 61.8% level or the ‘golden ratio’ which lent some optimism in the market.
Further optimism was driven by a bullish crossover in the MACD, and the CMF, which showed strong capital inflows for ADA. Successfully defending the 61.8% Fibonacci level from the bears could fuel a bullish bounce back in the short-term.
EOS

Resistance at $4.04 has proven to be a formidable barrier as EOS failed to rise above the upper ceiling despite several attempts in a span of nearly two weeks. The scarcity of buyers in the market was one of the factors why the upwards breakout failed to culminate on the charts. The On Balance Volume attested to the bearish sentiment as the index failed pickup post EOS’ drop to $3.6 support.
Moreover, Bollinger Bands remained constricted and showed low volatility at the time of writing, which disallowed for large price swings in the coming sessions. Once the consolidation ends, a rise above the overhead resistance mark could spur some additional buying.
Synthetix [SNX]
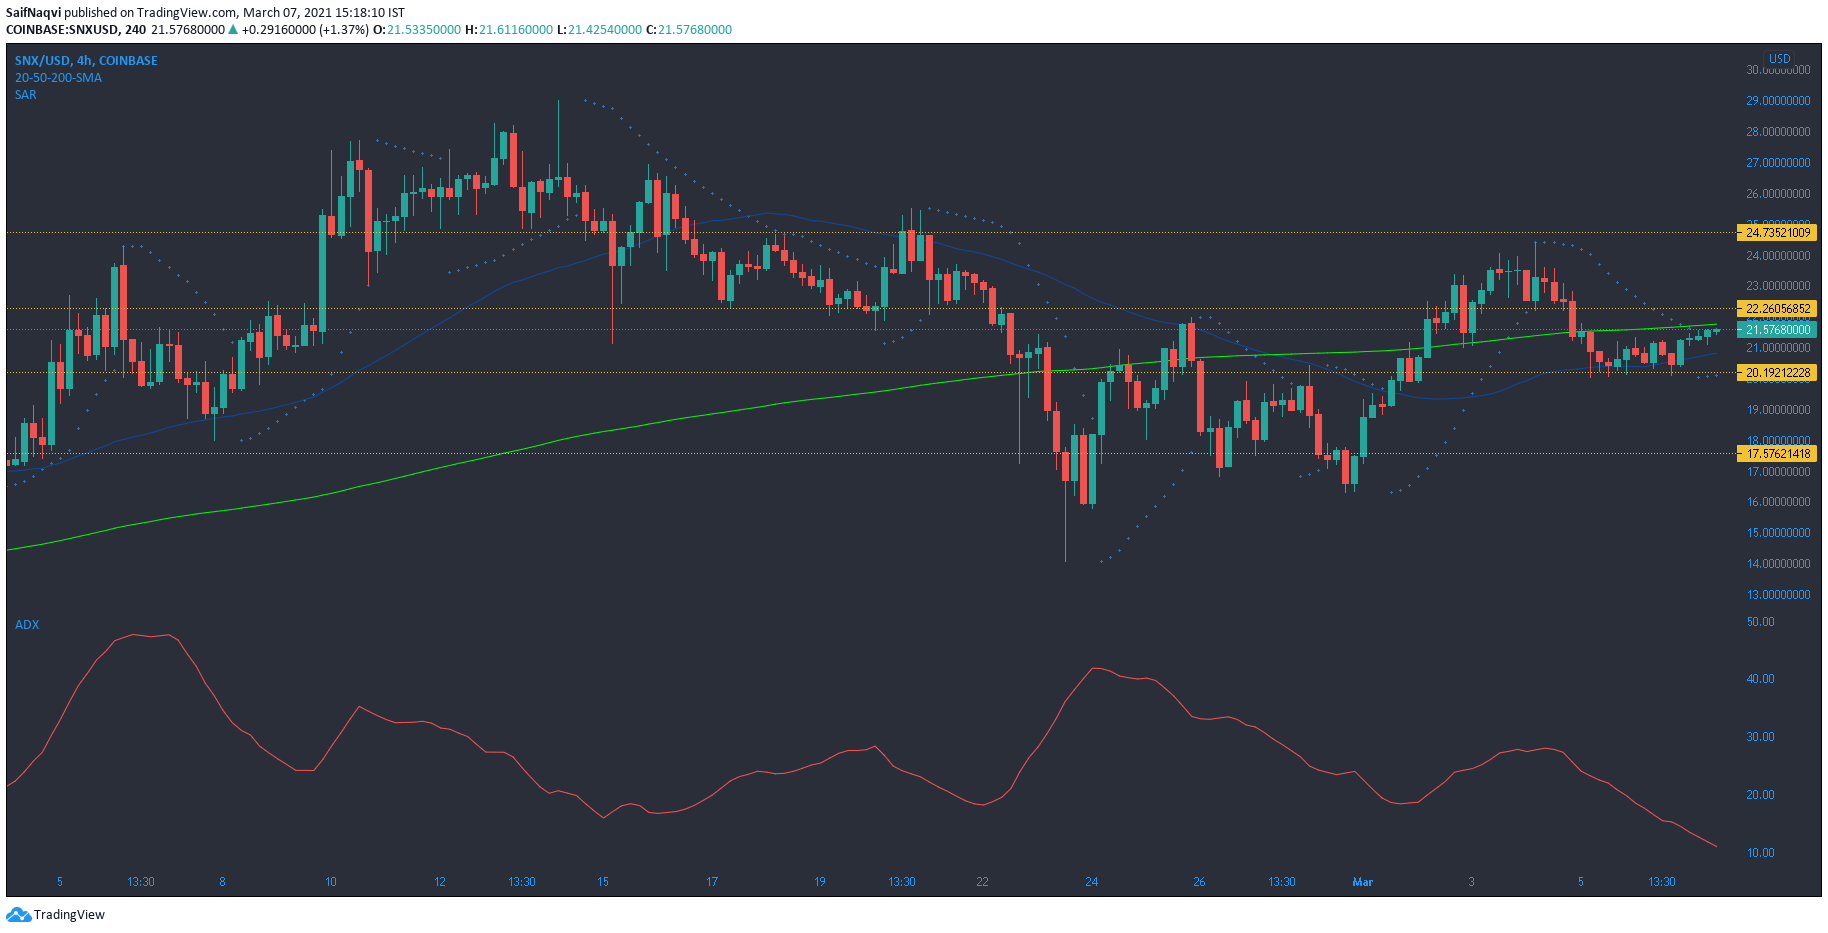
The ADX Indicator pointed south from the 10-mark as Synthetix moved between the channel $22.26 and $20.19. However, the appearance of short green candlesticks on the 4-hour chart showed that the bulls met with minimal selling pressure as the price inched closer to its 200-SMA. The Parabolic SAR’s dotted markers moved beneath the candlesticks and highlighted the change of trend.
For a breakout above the long-term moving average, the 24-hour trading volumes could be monitored over the coming sessions. In the event of a bullish outcome, resistance at $24.7 could be tested.


![Rising bond yields put Bitcoin [BTC] at risk — a Fed rate hike could be next](https://ambcrypto.com/wp-content/uploads/2026/08/IMG_4752-e1785656382502.webp)