Cardano, Ethereum, Polkadot Price Analysis: 17 May

Cardano could witness an extended rally if losses are maintained at $2.17. Ethereum broke south from a descending triangle and lost a key support region at $3,620. Finally, Polkadot was in danger of a sharp sell-off in case of a break below $38.5.
Cardano [ADA]
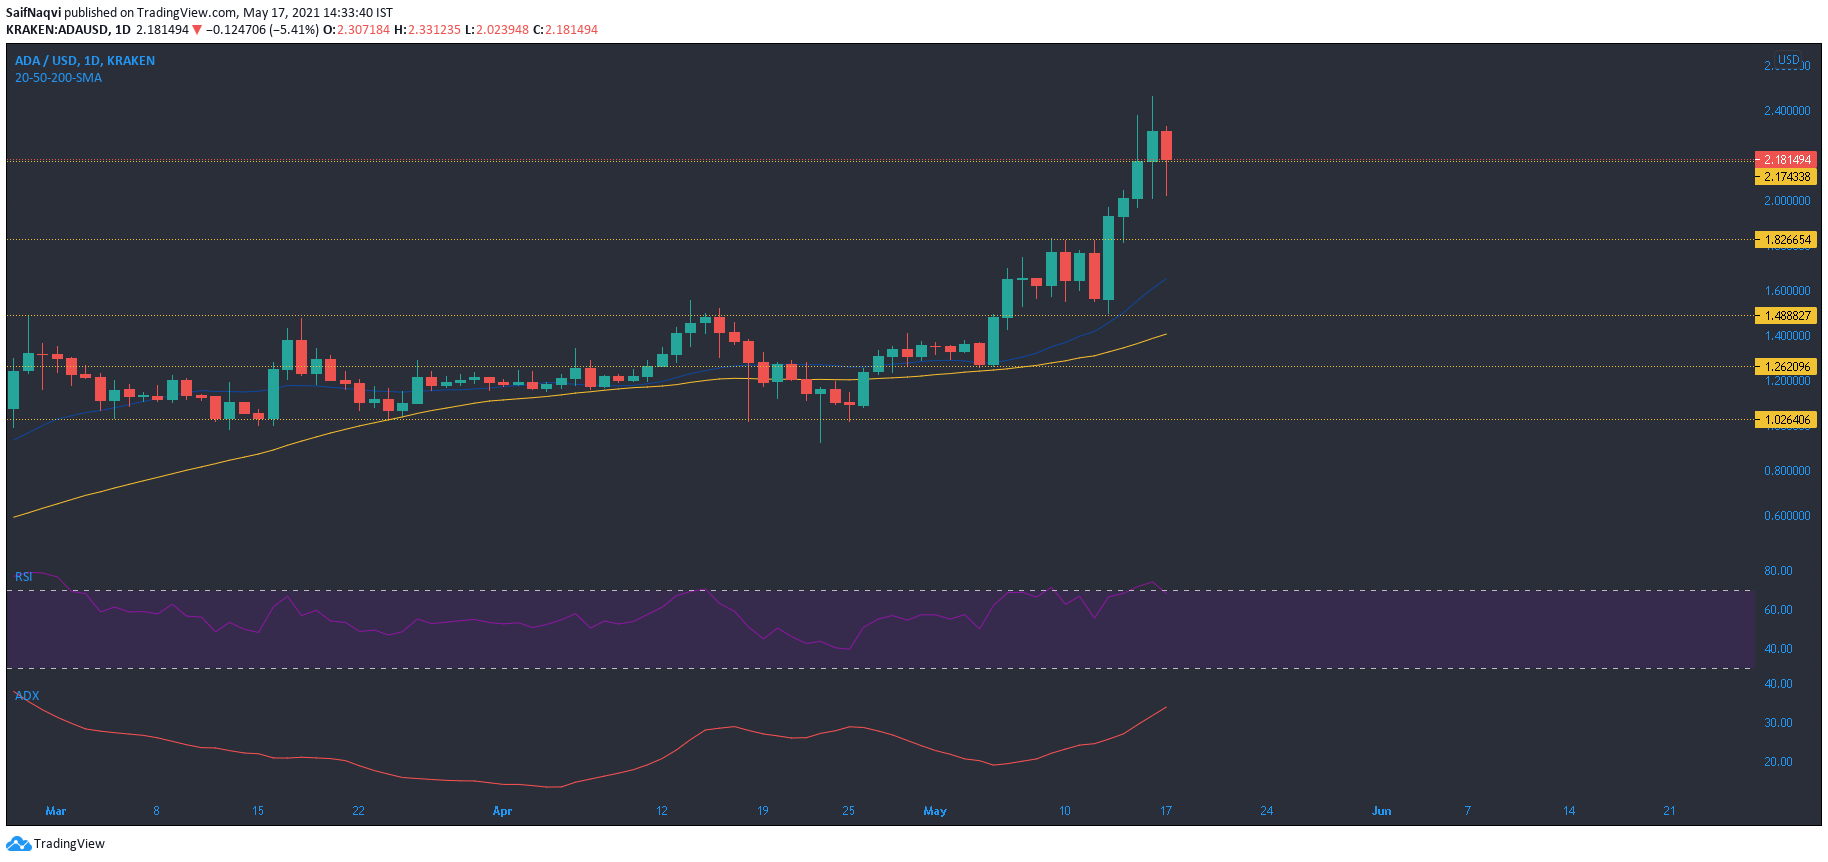
Volumes on Cardano took a dip over the last 24 hours as buying activity came to a halt. After an impressive run that saw ADA post weekly gains of 22%, a correction had finally hit the market. A fall of 8% dragged ADA towards a newly discovered support zone at $2.17. A stronger support area lay between $1.82-1.48 and even clashed with the 20-SMA (blue). This confluence between the moving average and support zones would see a re-emergence of buyers should another dip take place.
Post the pullback, ADA presented the next target at $2.50. This psychological level could be snapped during the current bull run if buyers trimmed losses at $2.17. RSI moved south from the overbought zone but would likely stay in bullish territory above 55. ADX rose north of 32 and highlighted a strong trend in the market.
Ethereum [ETH]
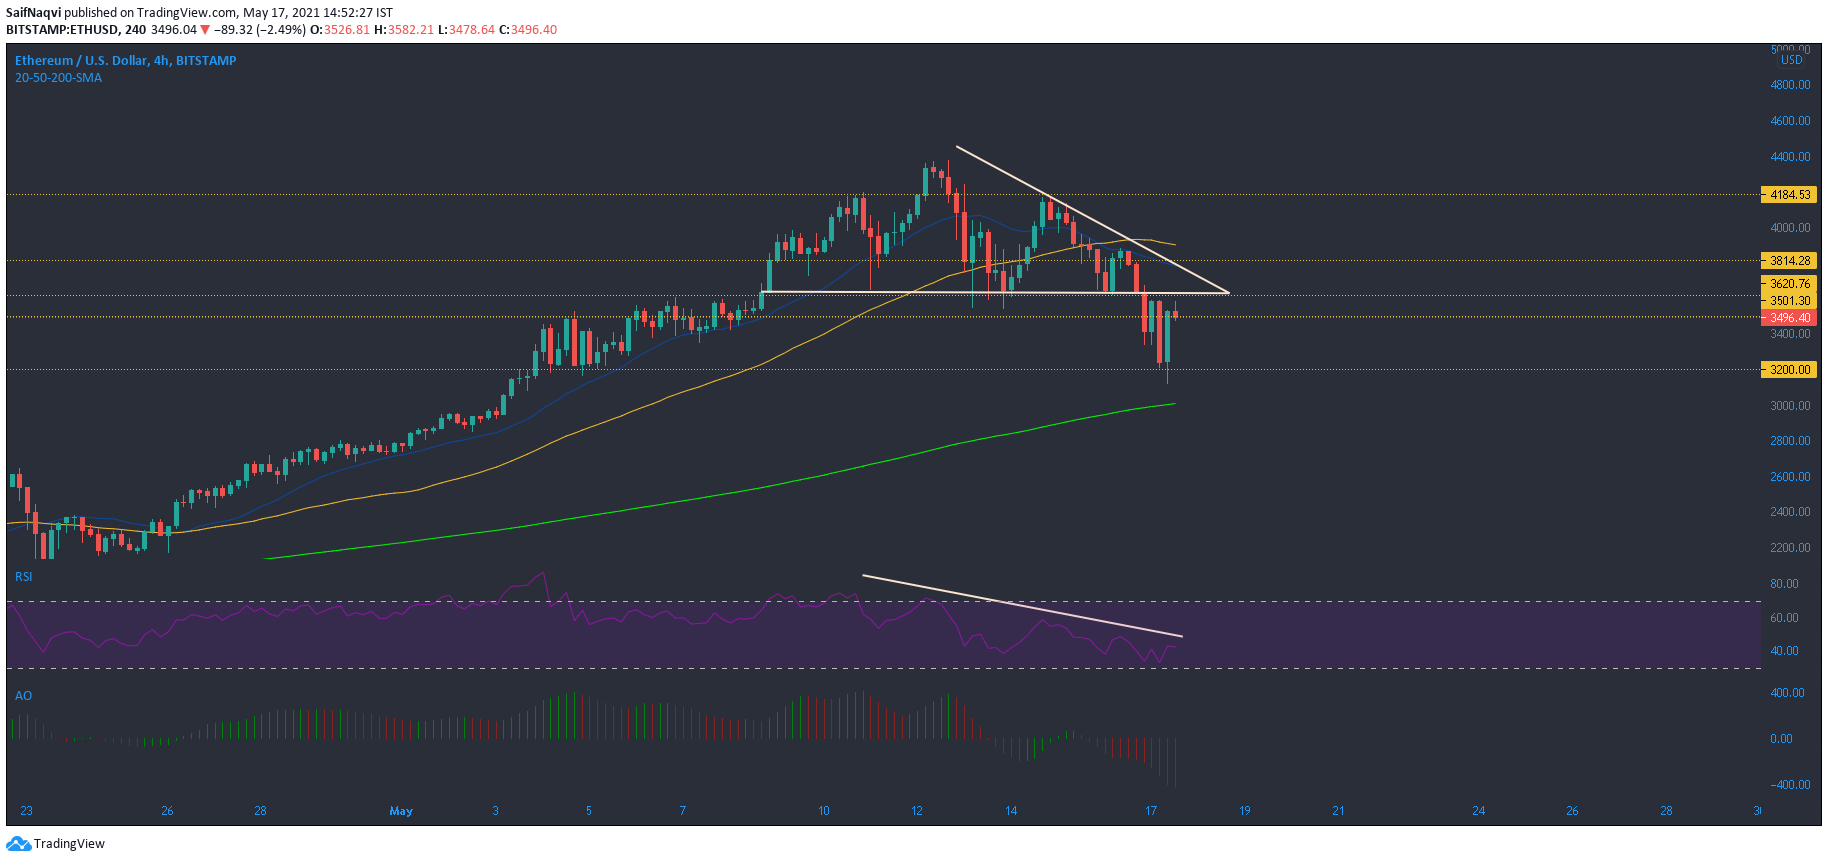
The more price-sensitive 4-hour timeframe highlighted certain bearish conditions in the Ethereum market that were hard to overlook. A descending triangle breakdown showed losses of 11% from the bottom trendline. This trendline also represented a strong defensive point at $3,620 and a southbound move saw extended losses up to $3,200. A green candlestick did indicate some bullish response and a rise above $3,620 could initiate a recovery towards $3,800.
Lower lows on RSI indicated weakening and confirmed ETH’s short-term bearish movement. Awesome Oscillator highlighted profit-taking as selling pressure was on the up. In case of further losses, 200-SMA around $3,000 could form another defensive barrier. Alternatively, the level around $3,800 saw some interplay between the 20-SMA (blue) and 50-SMA (yellow) and reclaiming this could trigger another bull run.
Polkadot [DOT]
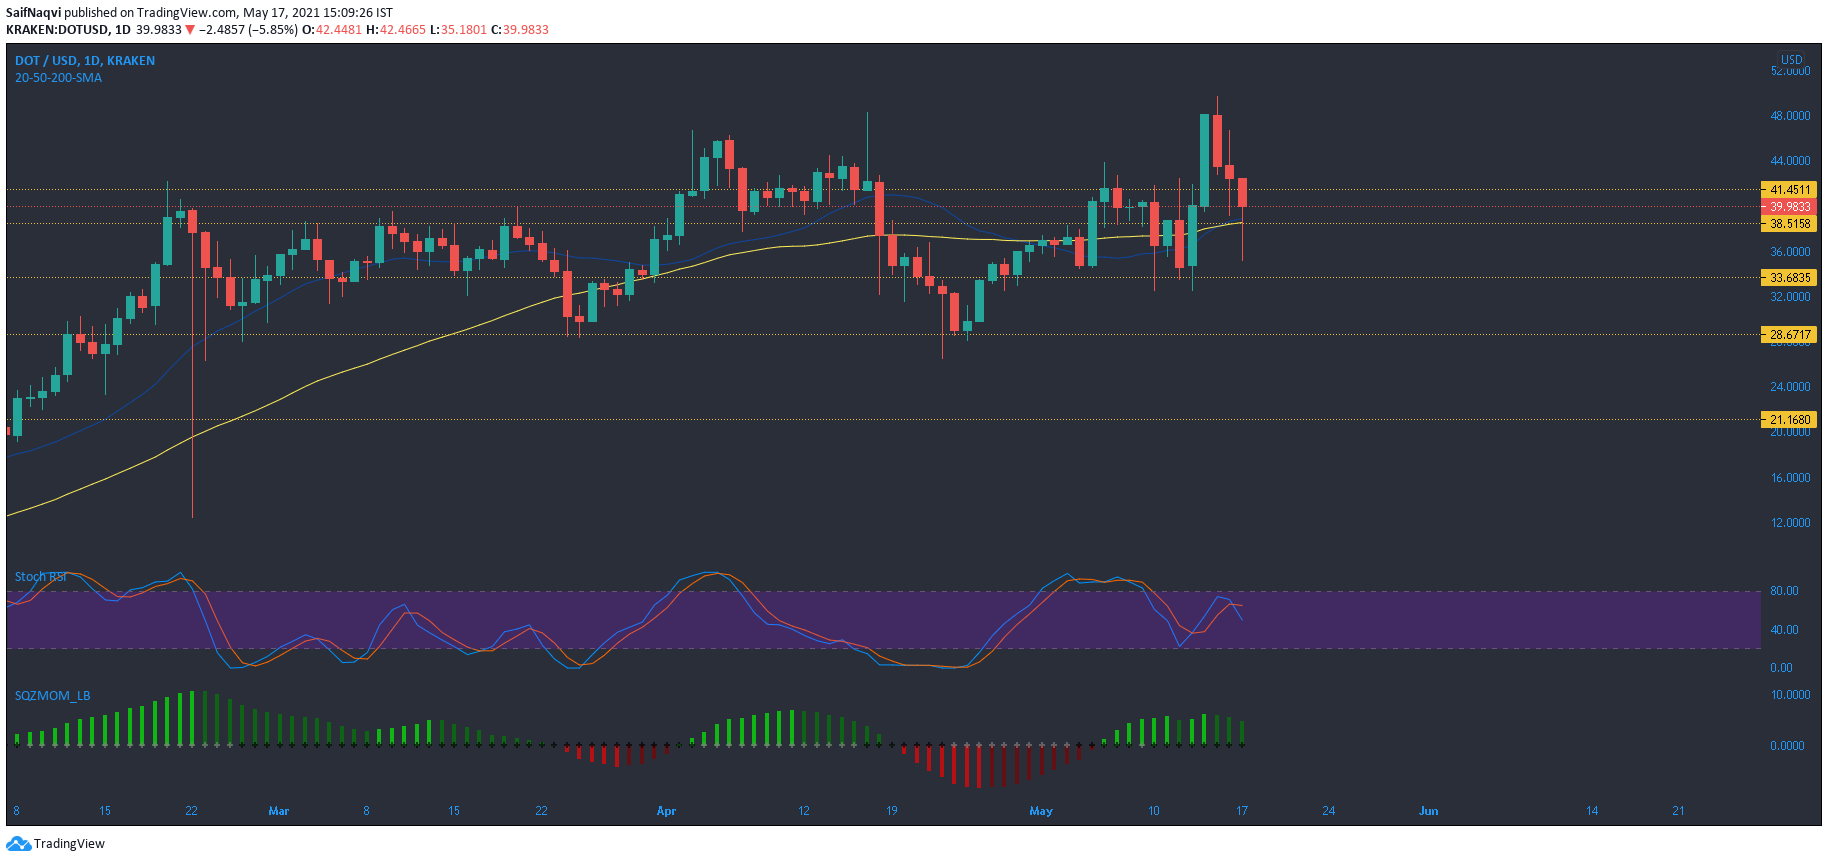
The formation of three candlesticks or ‘three black crows’ following an uptrend highlighted a strong shift of dynamics for Polkadot. Sharp bearish action dragged DOT below multiple support levels mentioned in a previous analysis. However, the daily timeframe outlined another buy zone at $38.5- a region that coincided with the 20-SMA and 50-SMA.
A break below this critical point could lead to an extended sell-off all the way towards $21.6 and 200-SMA (green). Conversely, a break above $44.5-$48 resistance could initiate a price hike. A bearish crossover in Stochastic RSI thwarted chances of a favorable outcome. Squeeze Momentum Indicator noted weakening buying pressure and a move below half-line would present sell signals.