
- The volume indicators for the daily timeframe showed that the selling pressure was not overwhelming.
- Cardano was not guaranteed to bounce from the lows, and traders must beware of BTC’s price moves as well.
Cardano [ADA] faced rejection at the $0.75-$0.76 area in the hours preceding press time. Bitcoin [BTC] saw a 2.38% decline in seven hours, dragging ADA down by 4.68%. An earlier report noted that the price’s reaction at the $0.8 resistance zone would be telling.
The bulls were rebuffed before testing that resistance as BTC witnessed weekend volatility, rocking the altcoin market as well. Yet, the higher timeframe bias remained in place.
As long as the range formation was in play, ADA investors had a buying opportunity with a clear, close-by invalidation.
Time for Cardano bulls to bid on the dip

Source: ADA/USDT on TradingView
The market sentiment was shot — the fear and greed index stood at 30, indicating fear. It has denoted fearful sentiment throughout March.
Recent online activity and price action suggest ADA may struggle to maintain support at the $0.6 level. However, for swing traders, the risk-to-reward ratio still appears favorable.
The range low, highlighted at $0.682, positions ADA’s recent dip to $0.58 as an area where liquidity has likely accumulated. This could potentially pull prices lower.
Despite this, last week’s low at $0.647 offers an opportunity for long entries, with stop-losses recommended at 3%-5% below this level. This opportunity arises from the confluence of support at the range low and the lack of significant bearish pressure in technical indicators.
At the time of writing, the A/D line retraced the gains from early March but did not crash below local lows. Similarly, the CMF was within neutral territory, and capital outflows were significant according to the indicator.
The Awesome Oscillator also showed weak bearish momentum. All these factors marked the $0.65-$0.68 region as a likely candidate for a price bounce.
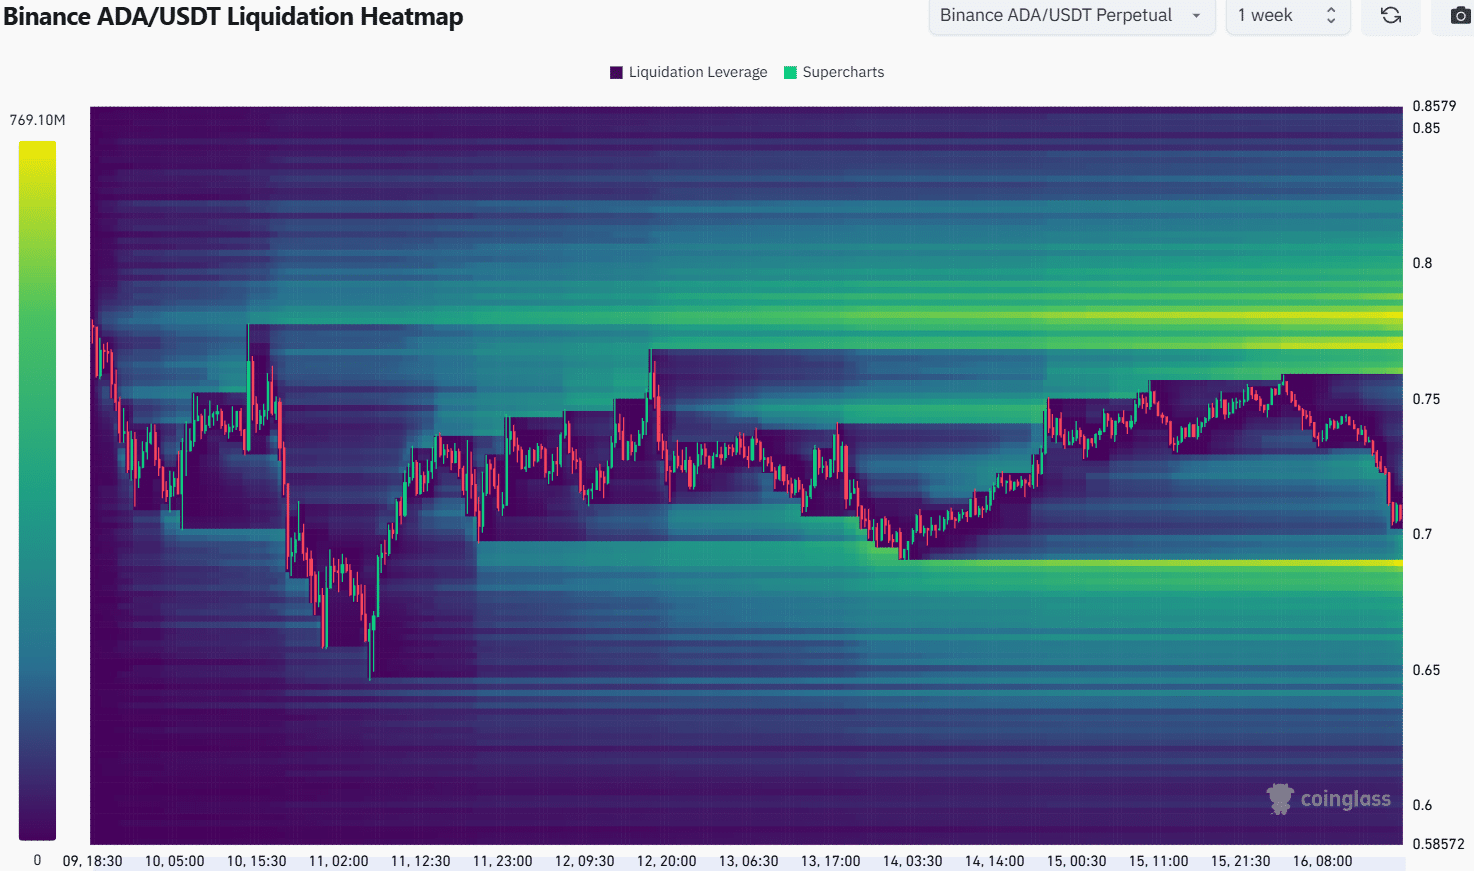
Source: Coinglass
The 1-week liquidation heatmap showed that the lows at $0.68-$0.69 was a liquidity pocket near the price. It was likely to pull prices lower before a price bounce.
However, it was not a guarantee that Cardano would bounce from here — it would be heavily dependent on BTC trends in the next 24–48 hours.
Disclaimer: The information presented does not constitute financial, investment, trading, or other types of advice and is solely the writer’s opinion