


Disclaimer: The information presented does not constitute financial, investment, trading, or other types of advice and is solely the opinion of the writer.
Cardano [ADA] has shed a whopping 85% in value over the past 11 months. In August 2021, the coin touched a high-water mark of $3. Once the $2.5 and $2 levels were flipped from support to resistance, the trend shifted quickly.
Cardano was already in a downtrend when the rest of the crypto market began to reach its peaks in November. The tumble of other tokens only accelerated the fall of Cardano on the price charts.
The past two months have seen a range established for ADA, but the price has fallen beneath the range lows over the past couple of days of trading. Now, the question is- Should Cardano buyers be wary of yet another wave of selling?
ADA- 1-Day Chart
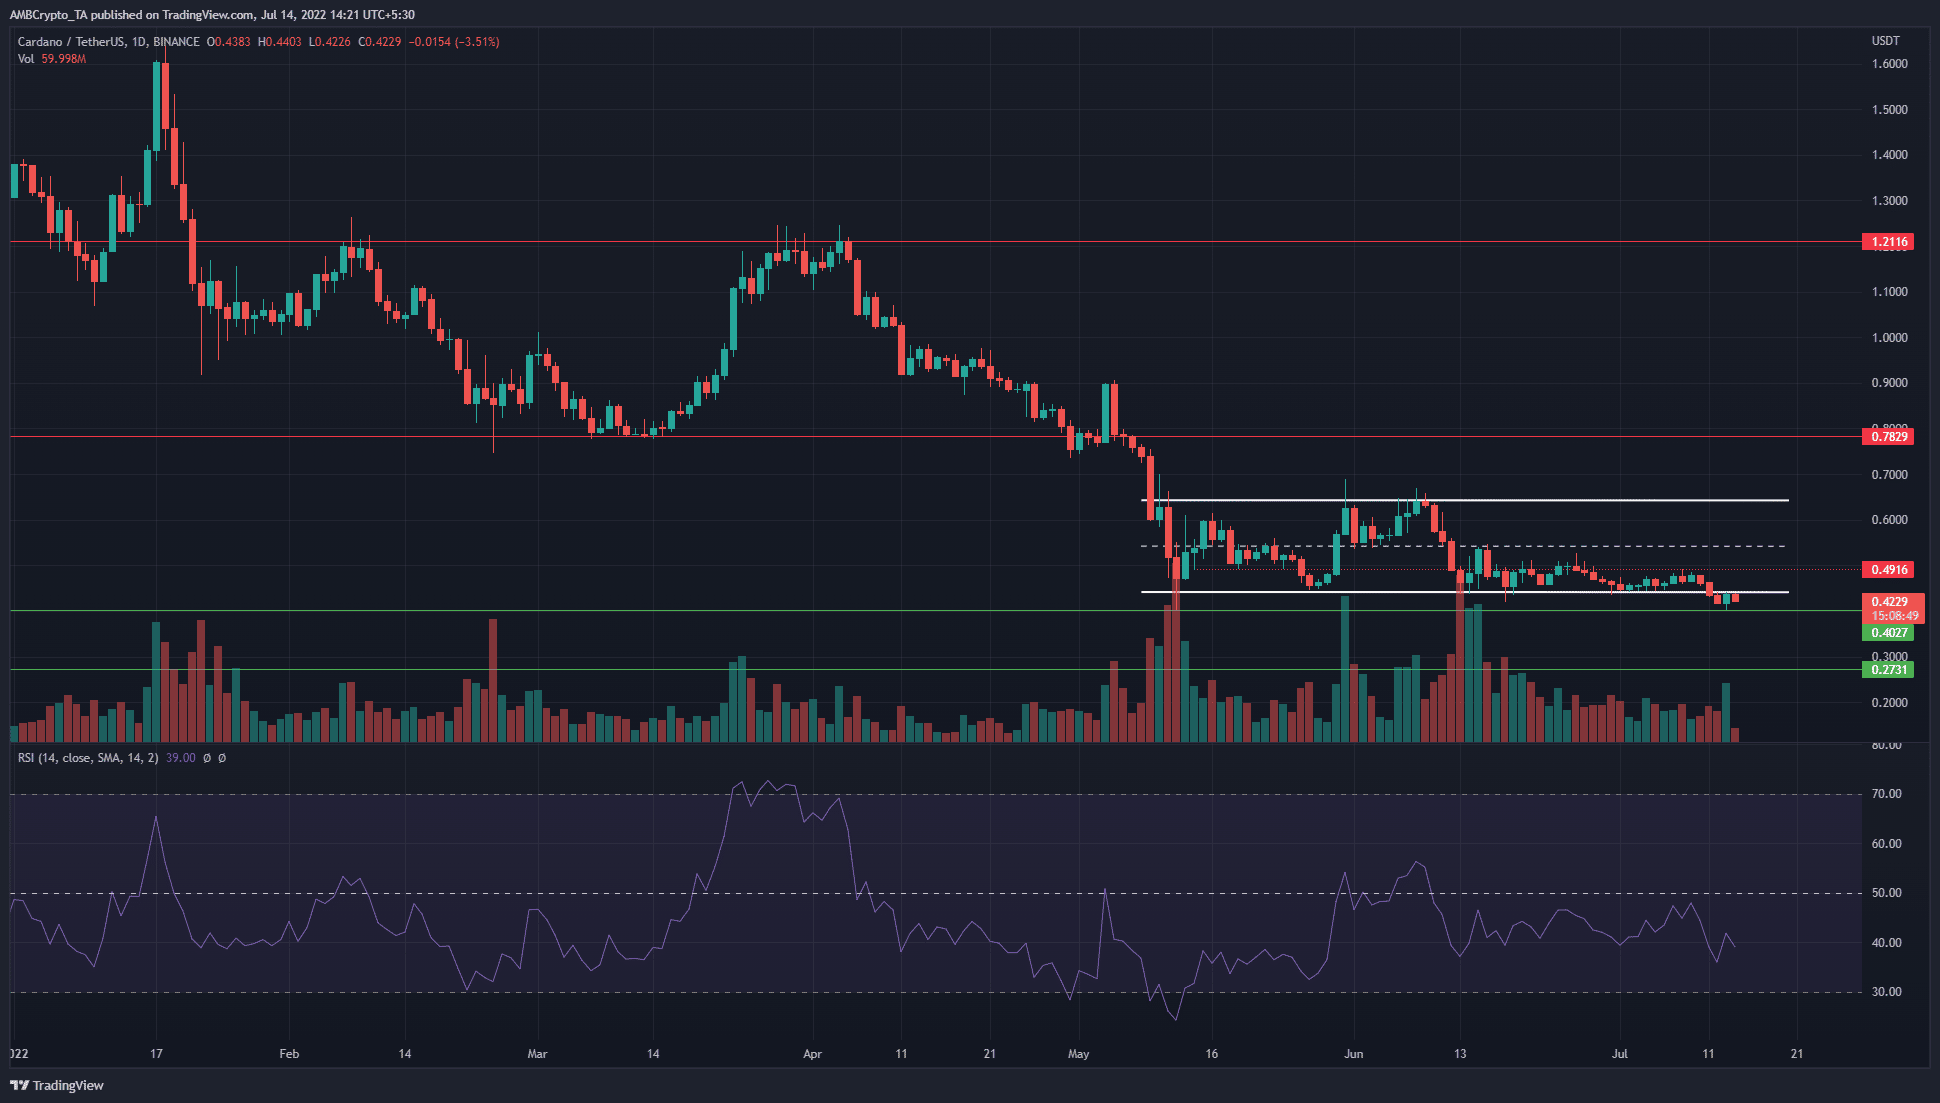
In white, a range from $0.64 to $0.44 was highlighted for ADA. The psychological $0.5 level has also acted as support and resistance. In fact, the $0.48-$0.51 area was a hotly contested region on the price chart.
The long-term trend was bearish, but the past two months have seen a range develop. If ADA closed a trading session below the $0.4 mark, another leg downward would become far more likely.
ADA- 4-Hour Chart
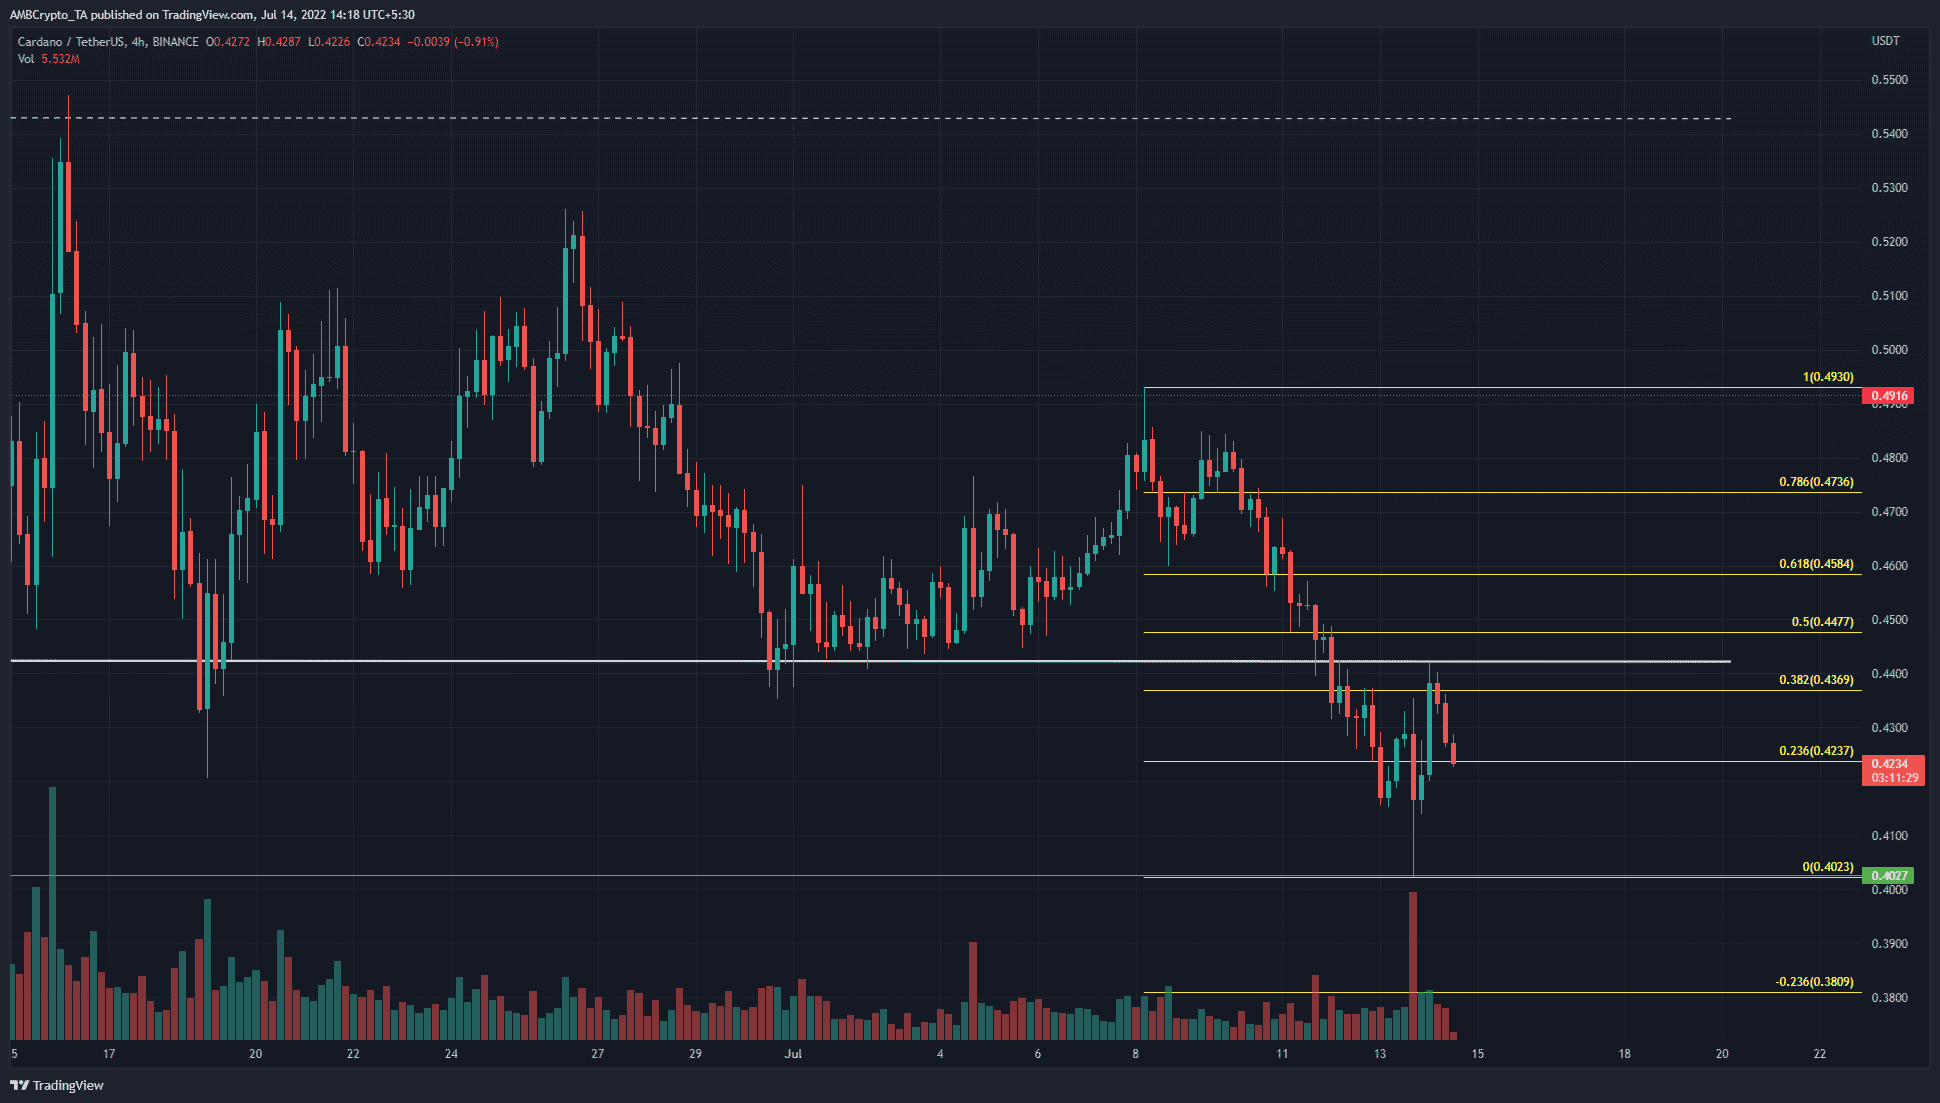
The four-hour chart showed an asset in decline. ADA set a series of lower highs in the past four weeks. Moreover, the $0.44 demand zone has also been ceded to the bears. It was tested as resistance the previous day as well before ADA began to decline once more.
A set of Fibonacci retracement levels (yellow) were plotted based on the move from $0.49 to $0.4 last week. The 38.2% retracement level stood resolute upon a retest from the south. It also has confluence with the range lows (white), which demarcated the $0.44 region as an intense area of selling.
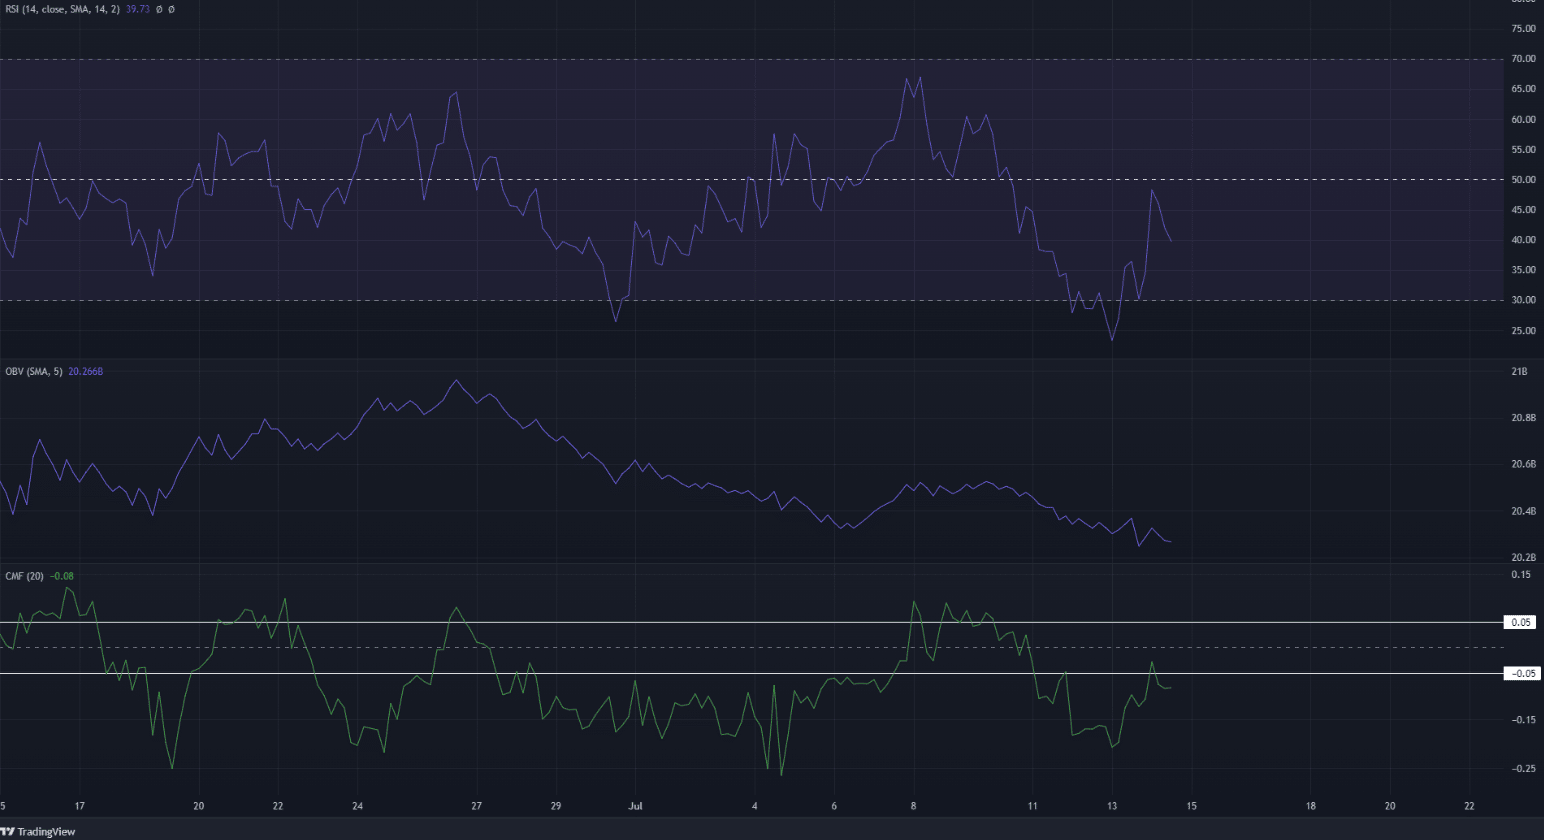
The Relative Strength Index (RSI) slipped back beneath the neutral 50 line. It climbed to 47 but faced rejection, which strengthened the idea of bearish momentum behind Cardano on the charts.
Furthermore, the On-Balance-Volume (OBV) has been in decline in recent weeks as well. This showed strong selling volume and a lack of buyers beneath the $0.5 level.
The Chaikin Money Flow (CMF) has also been below -0.05 for a good chunk of the past month. Once more, a significant capital flow out of the Cardano market was signaled.
Conclusion
The indicators showed bearish momentum and high selling pressure. The market structure was also bearish on lower timeframes. The rally from $0.43 in late June was unable to advance past $0.48, and the past week saw all those gains wiped out.
To the south, $0.4 and $0.38 are likely to serve as support levels. A long-term horizontal level of significance was present at $0.27 as well.