- Cardano’s price hiked by over 6% in the last seven days
- Most metrics and indicators seemed to be in favor of a bullish breakout
Cardano [ADA] bulls have made a comeback lately, as both the token’s daily and weekly charts were green at press time. In fact, if the latest data is to be considered, things might get even better for the token as a bullish pattern seems to be appearing on its chart. The prospective rally might then push ADA’s price up by double digits.
Cardano turns bullish
Cardano has lost a significant percentage of its market capitalization over the last few months. Owing to this price decline, over 66% of ADA investors were pushed out of money.
However, IntoTheBlock’s data revealed that long-term investors remain confident in Cardano. This assertion can be backed by the fact that nearly 70% of ADA investors have been holding the token for more than a year.
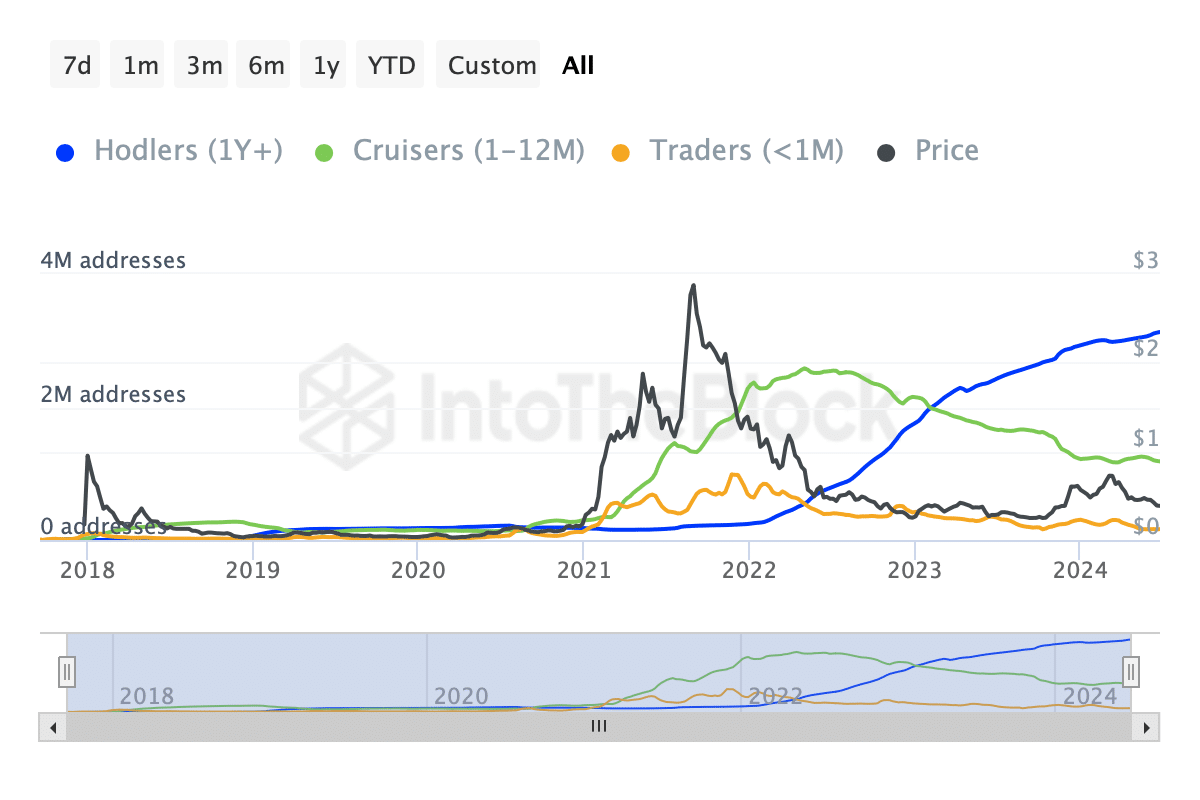
Source: IntoTheBlock
Long-term holders’ confidence has now started to pay off as ADA’s charts turned green.
According to CoinMarketCap, Cardano’s price appreciated by more than 6% in the last seven days and 2% in the last 24 hours. At the time of writing, ADA was trading at $0.397 with a market cap of over $14.2 billion.
The emergence of a bullish falling wedge pattern on the token’s chart promised better news too.
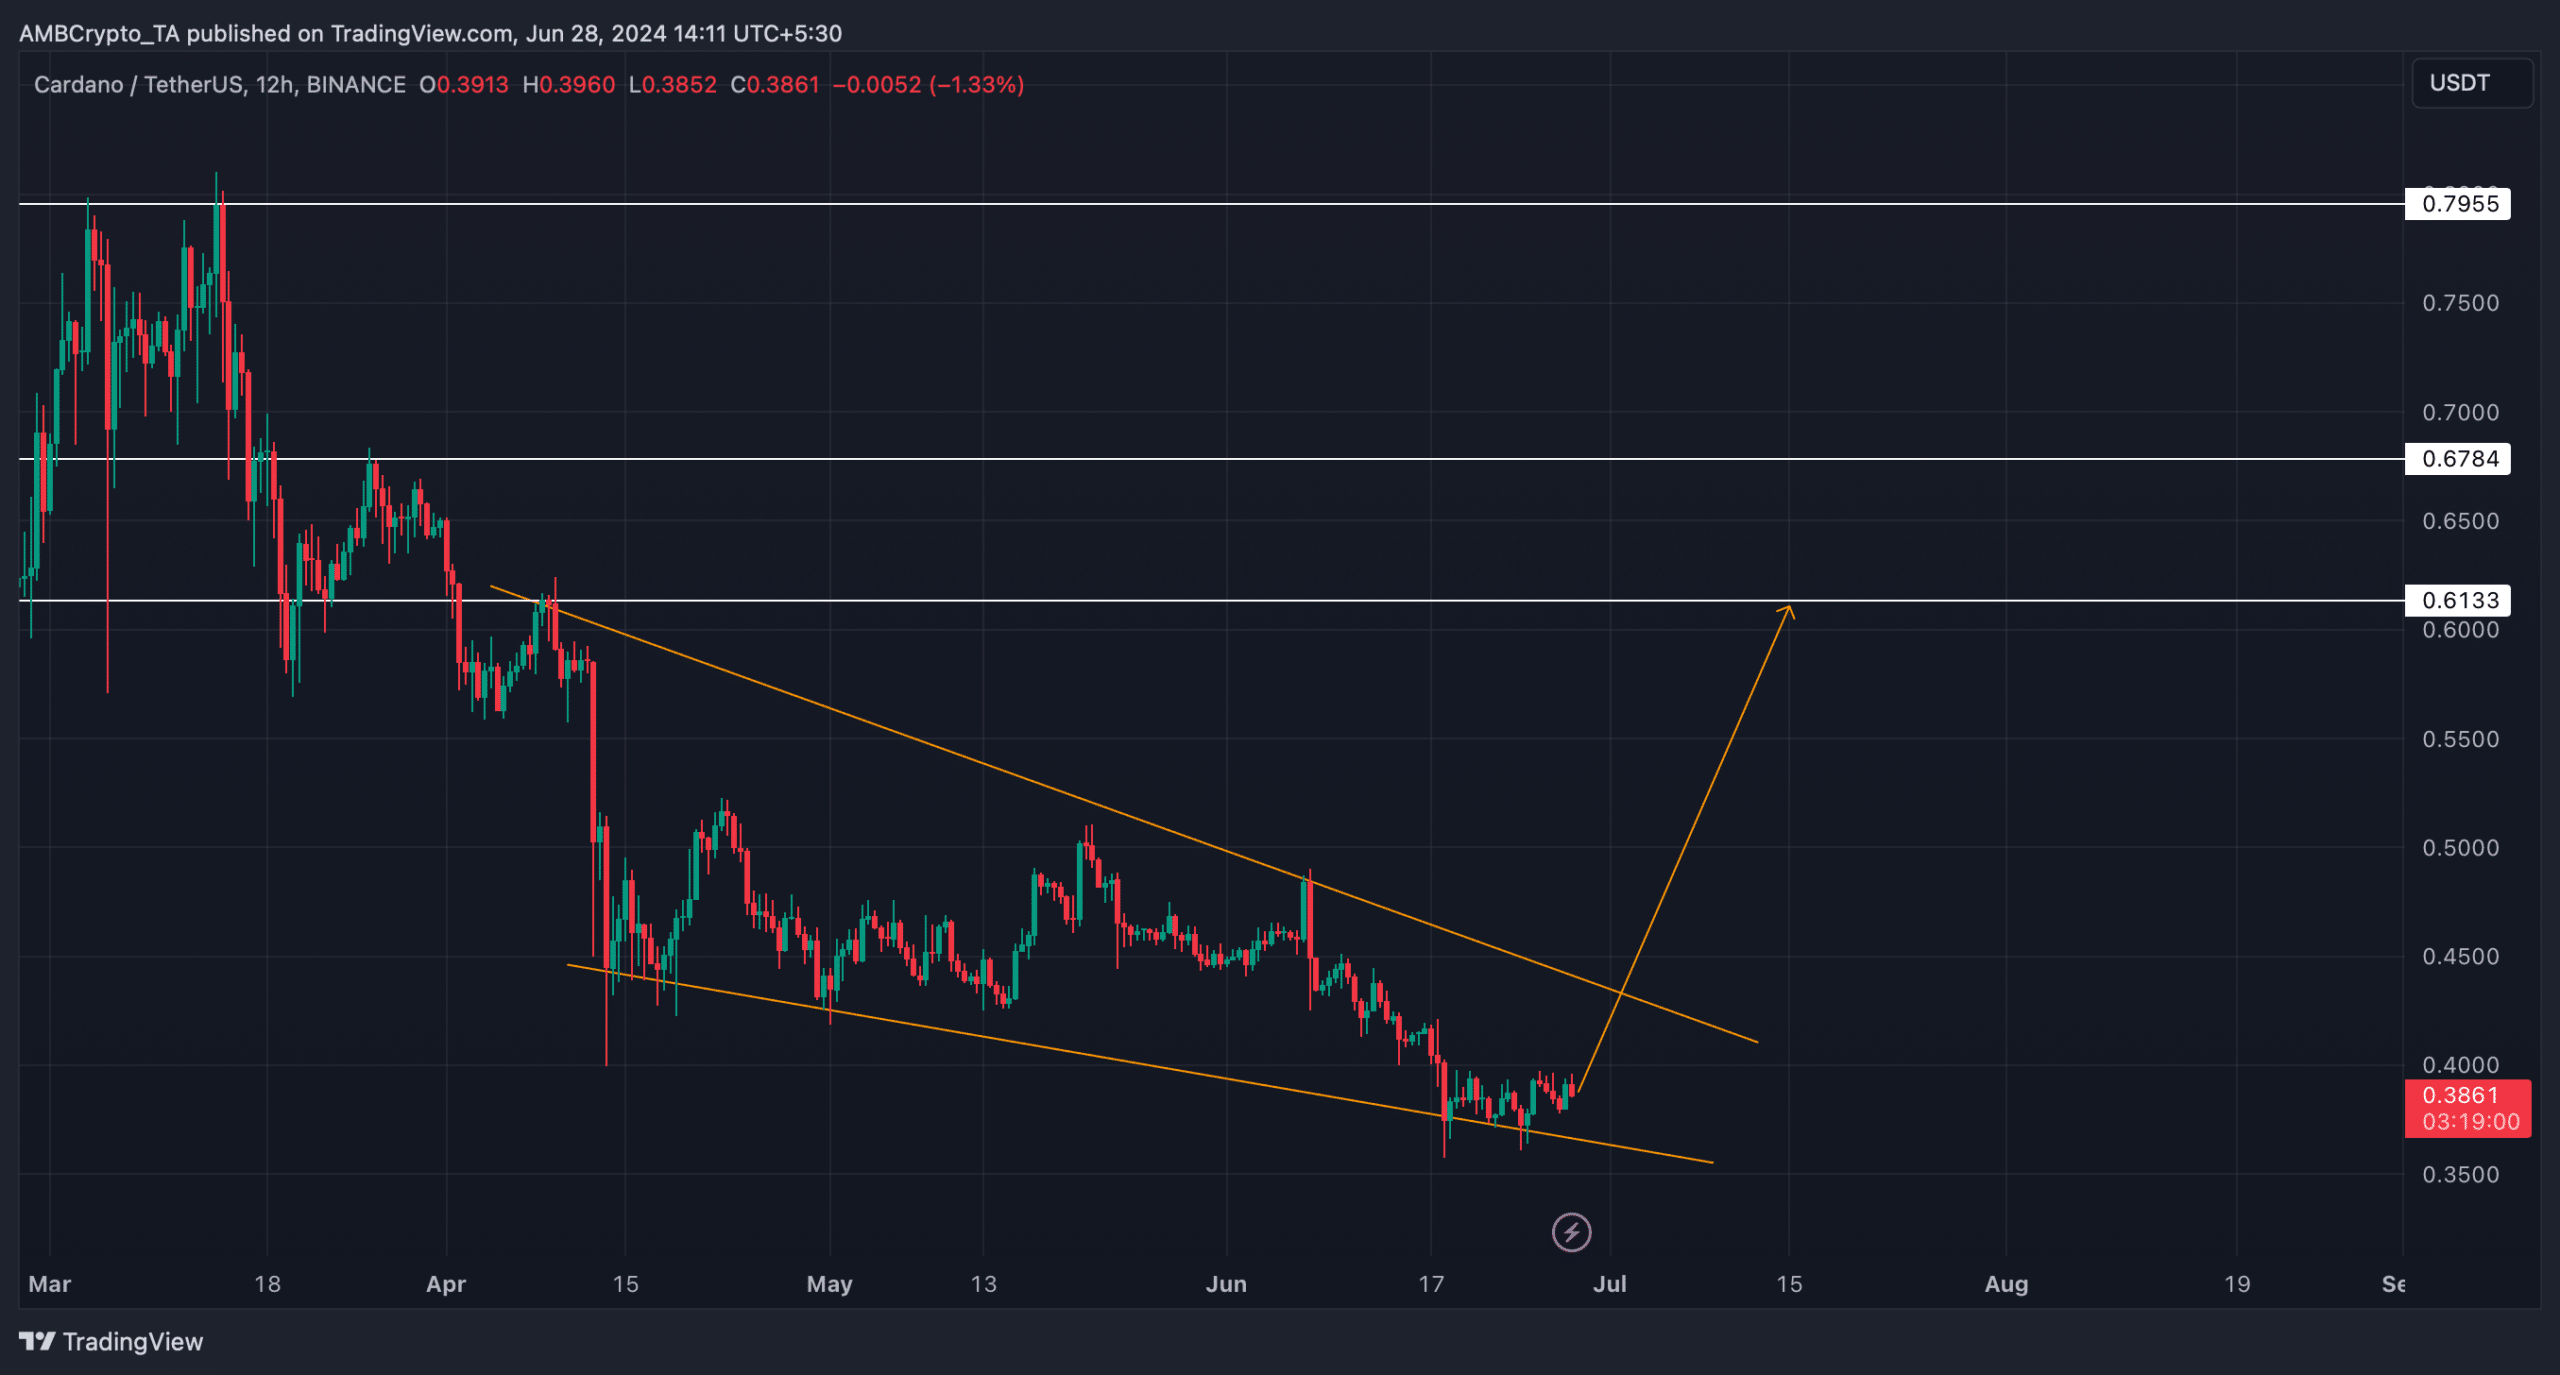
Source: TradingView
ADA started to consolidate inside this pattern in mid-April. It has now tested its support, and the recent price uptick hinted at a breakout from this pattern.
In case of a successful breakout, ADA investors might see a massive bull rally to $0.61. A successful breakout above this leve; could allow ADA to retest its March high of $0.79 in the coming weeks.
Is a breakout inevitable?
AMBCrypto then looked at Cardano’s on-chain data to see whether they supported the possibility of a bullish breakout. As per our analysis of Santiment’s data, ADA’s 1-day price volatility started to move up after a sharp decline.
Its MVRV ratio also improved substantially, which can be inferred as a bullish signal.
Additionally, its open interest also rose, along with its price. A hike in this metric usually suggests that the chances of the ongoing price trend continuing are high.
Nonetheless, at press time, ADA’s fear and greed index was in a neutral position, indicating that the market could head in either direction.
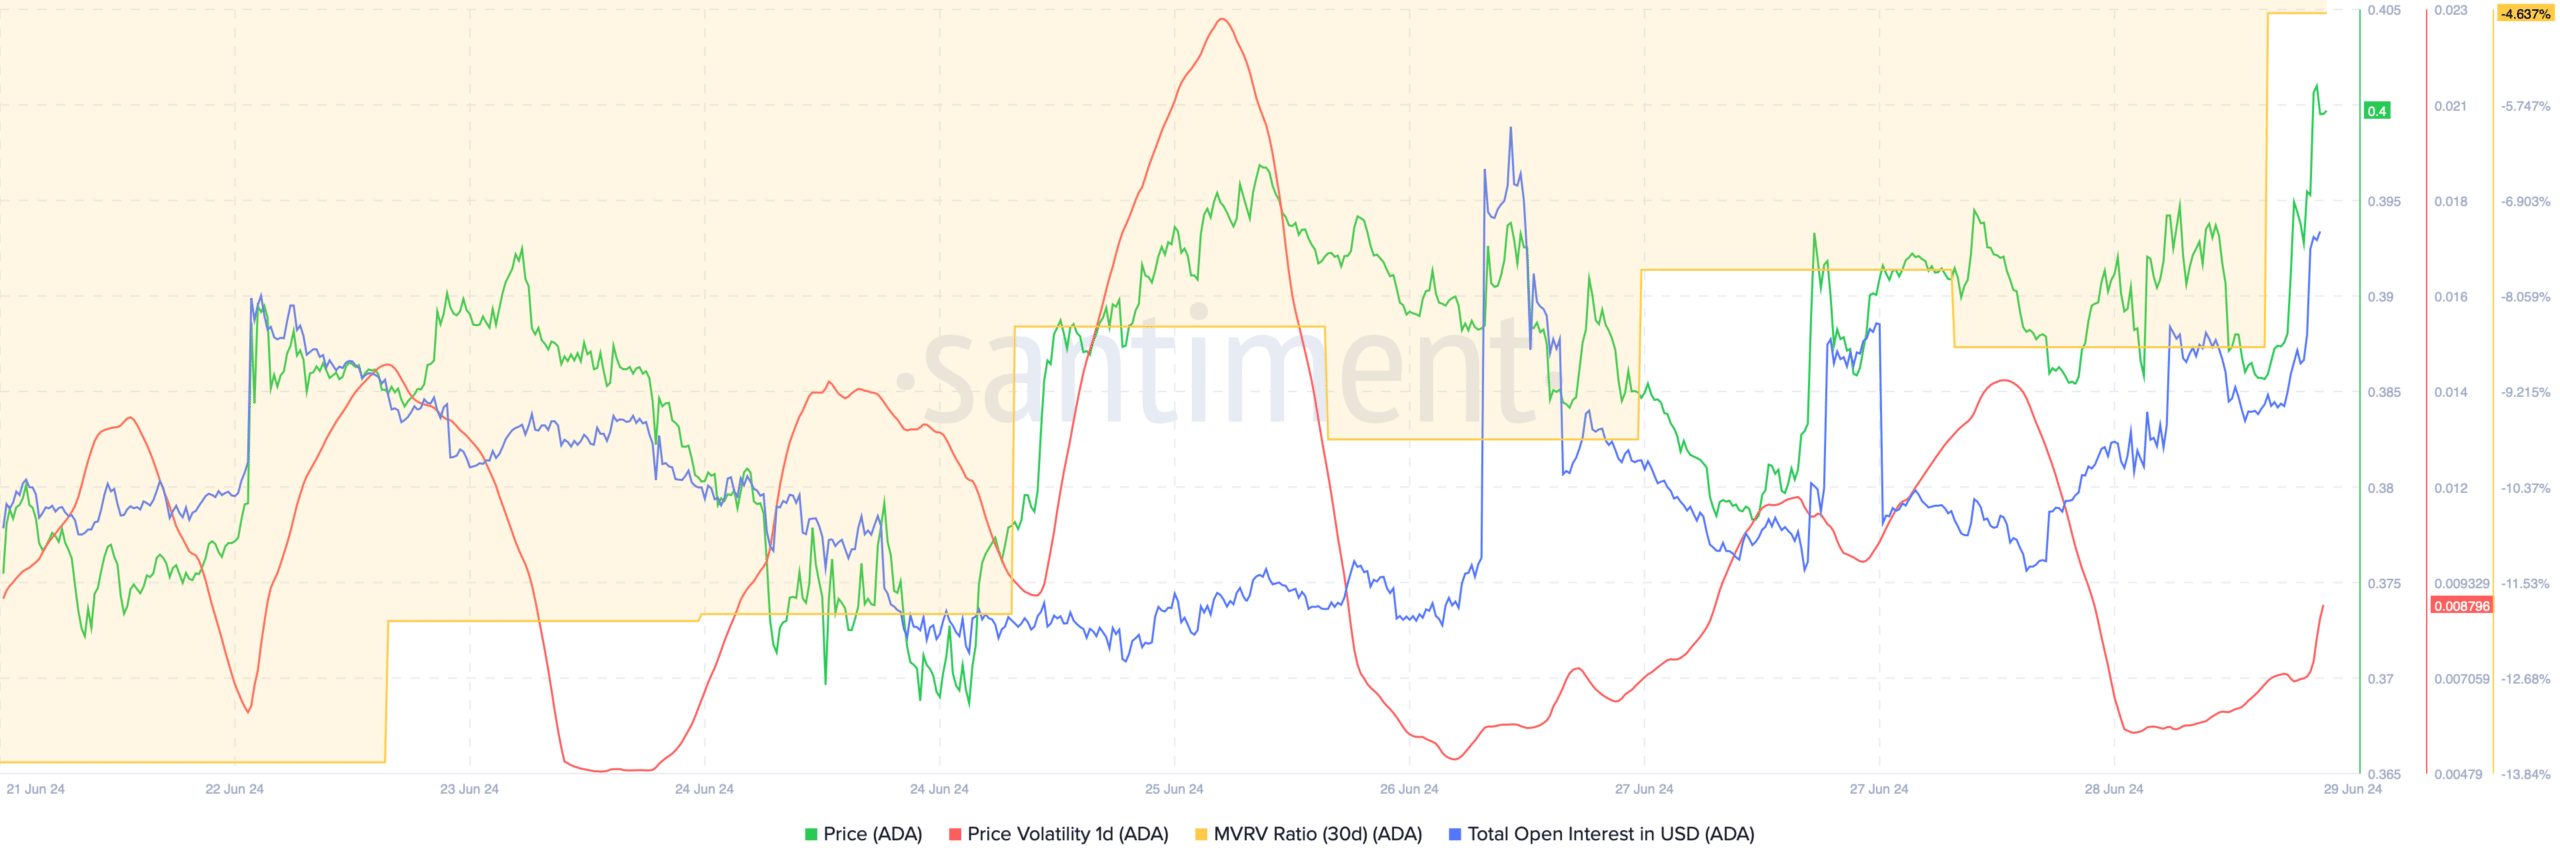
Source: Santiment
Is your portfolio green? Check out the Cardano Profit Calculator
The MACD, however, flashed a bullish crossover on the charts. ADA’s Relative Strength Index (RSI) registered a sharp uptick too, suggesting that it is likely that ADA will continue its rally, which might end up in a breakout from the falling wedge pattern.
Nonetheless, the Chaikin Money Flow (CMF) turned bearish as it headed south.
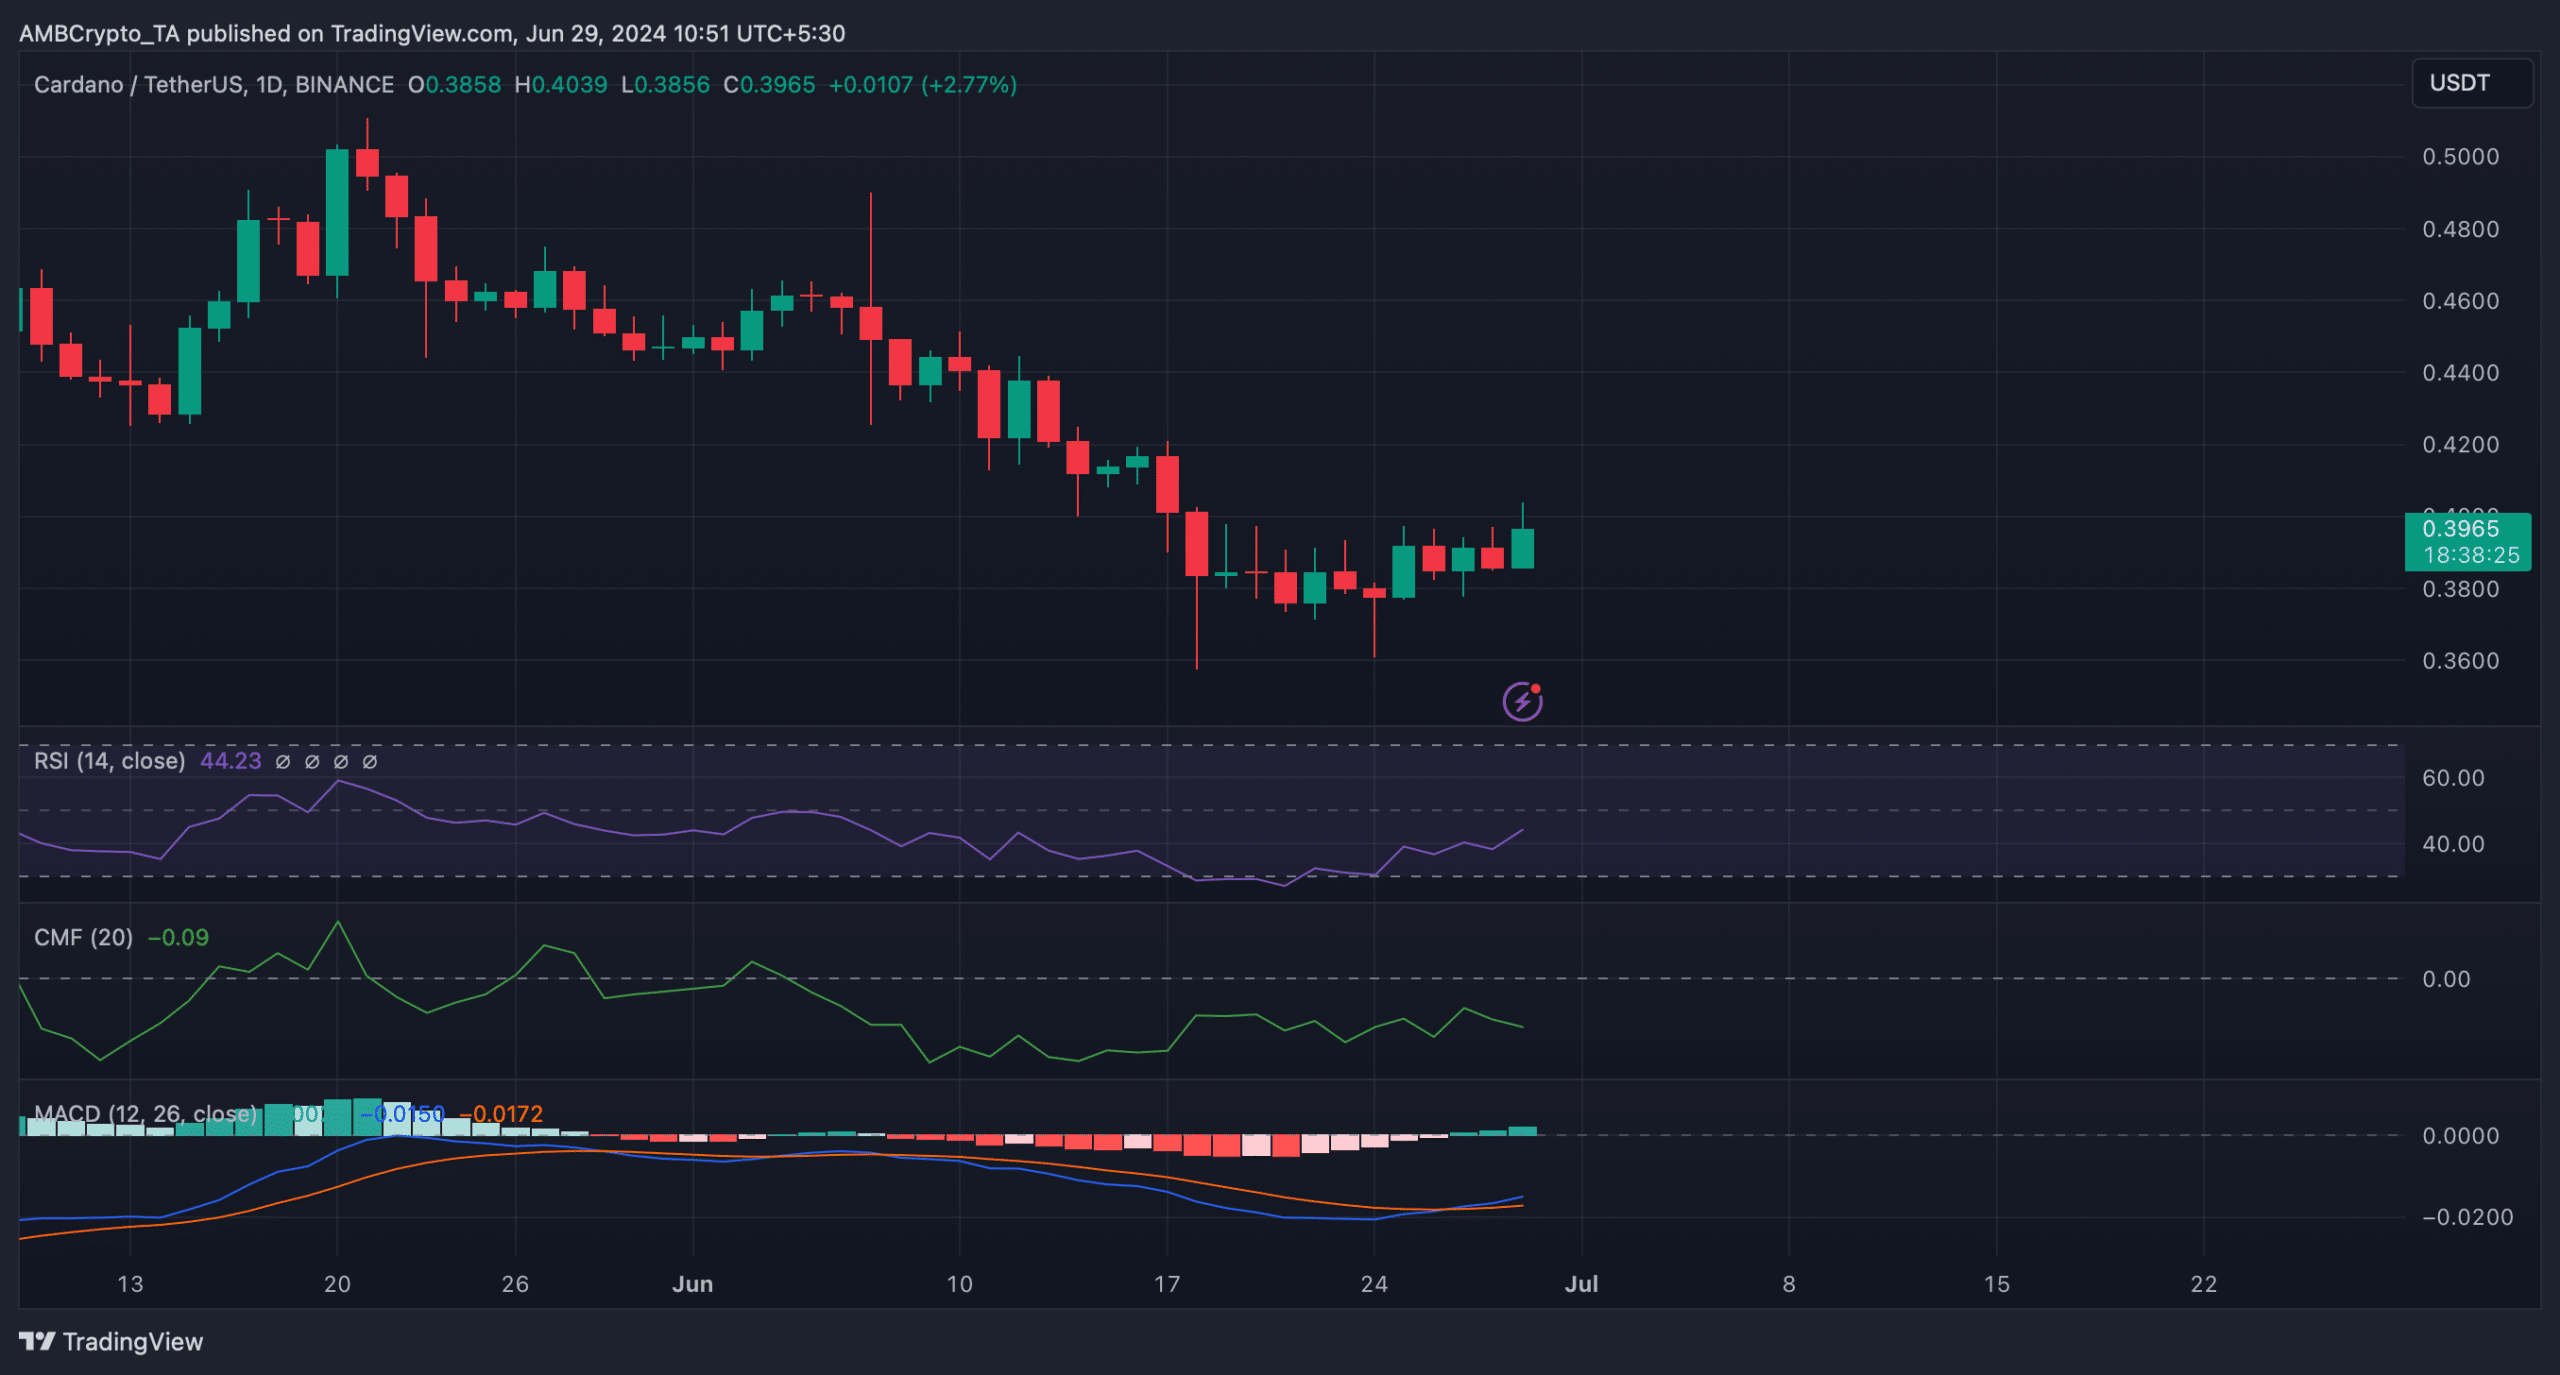
Source: TradingView