Cardano, LUNA, SAND Price Analysis: 14 February

Cardano broke down from its ascending channel while the buyers stepped in at the $1.02-mark support. Now, the bulls seem to be eyeing a reversal of the 20 EMA. Also, SAND lost its trendline support while marking an oversold 4-hour RSI.
On the other hand, Terra entered a low volatility phase near its Point of Control.
Cardano (ADA)
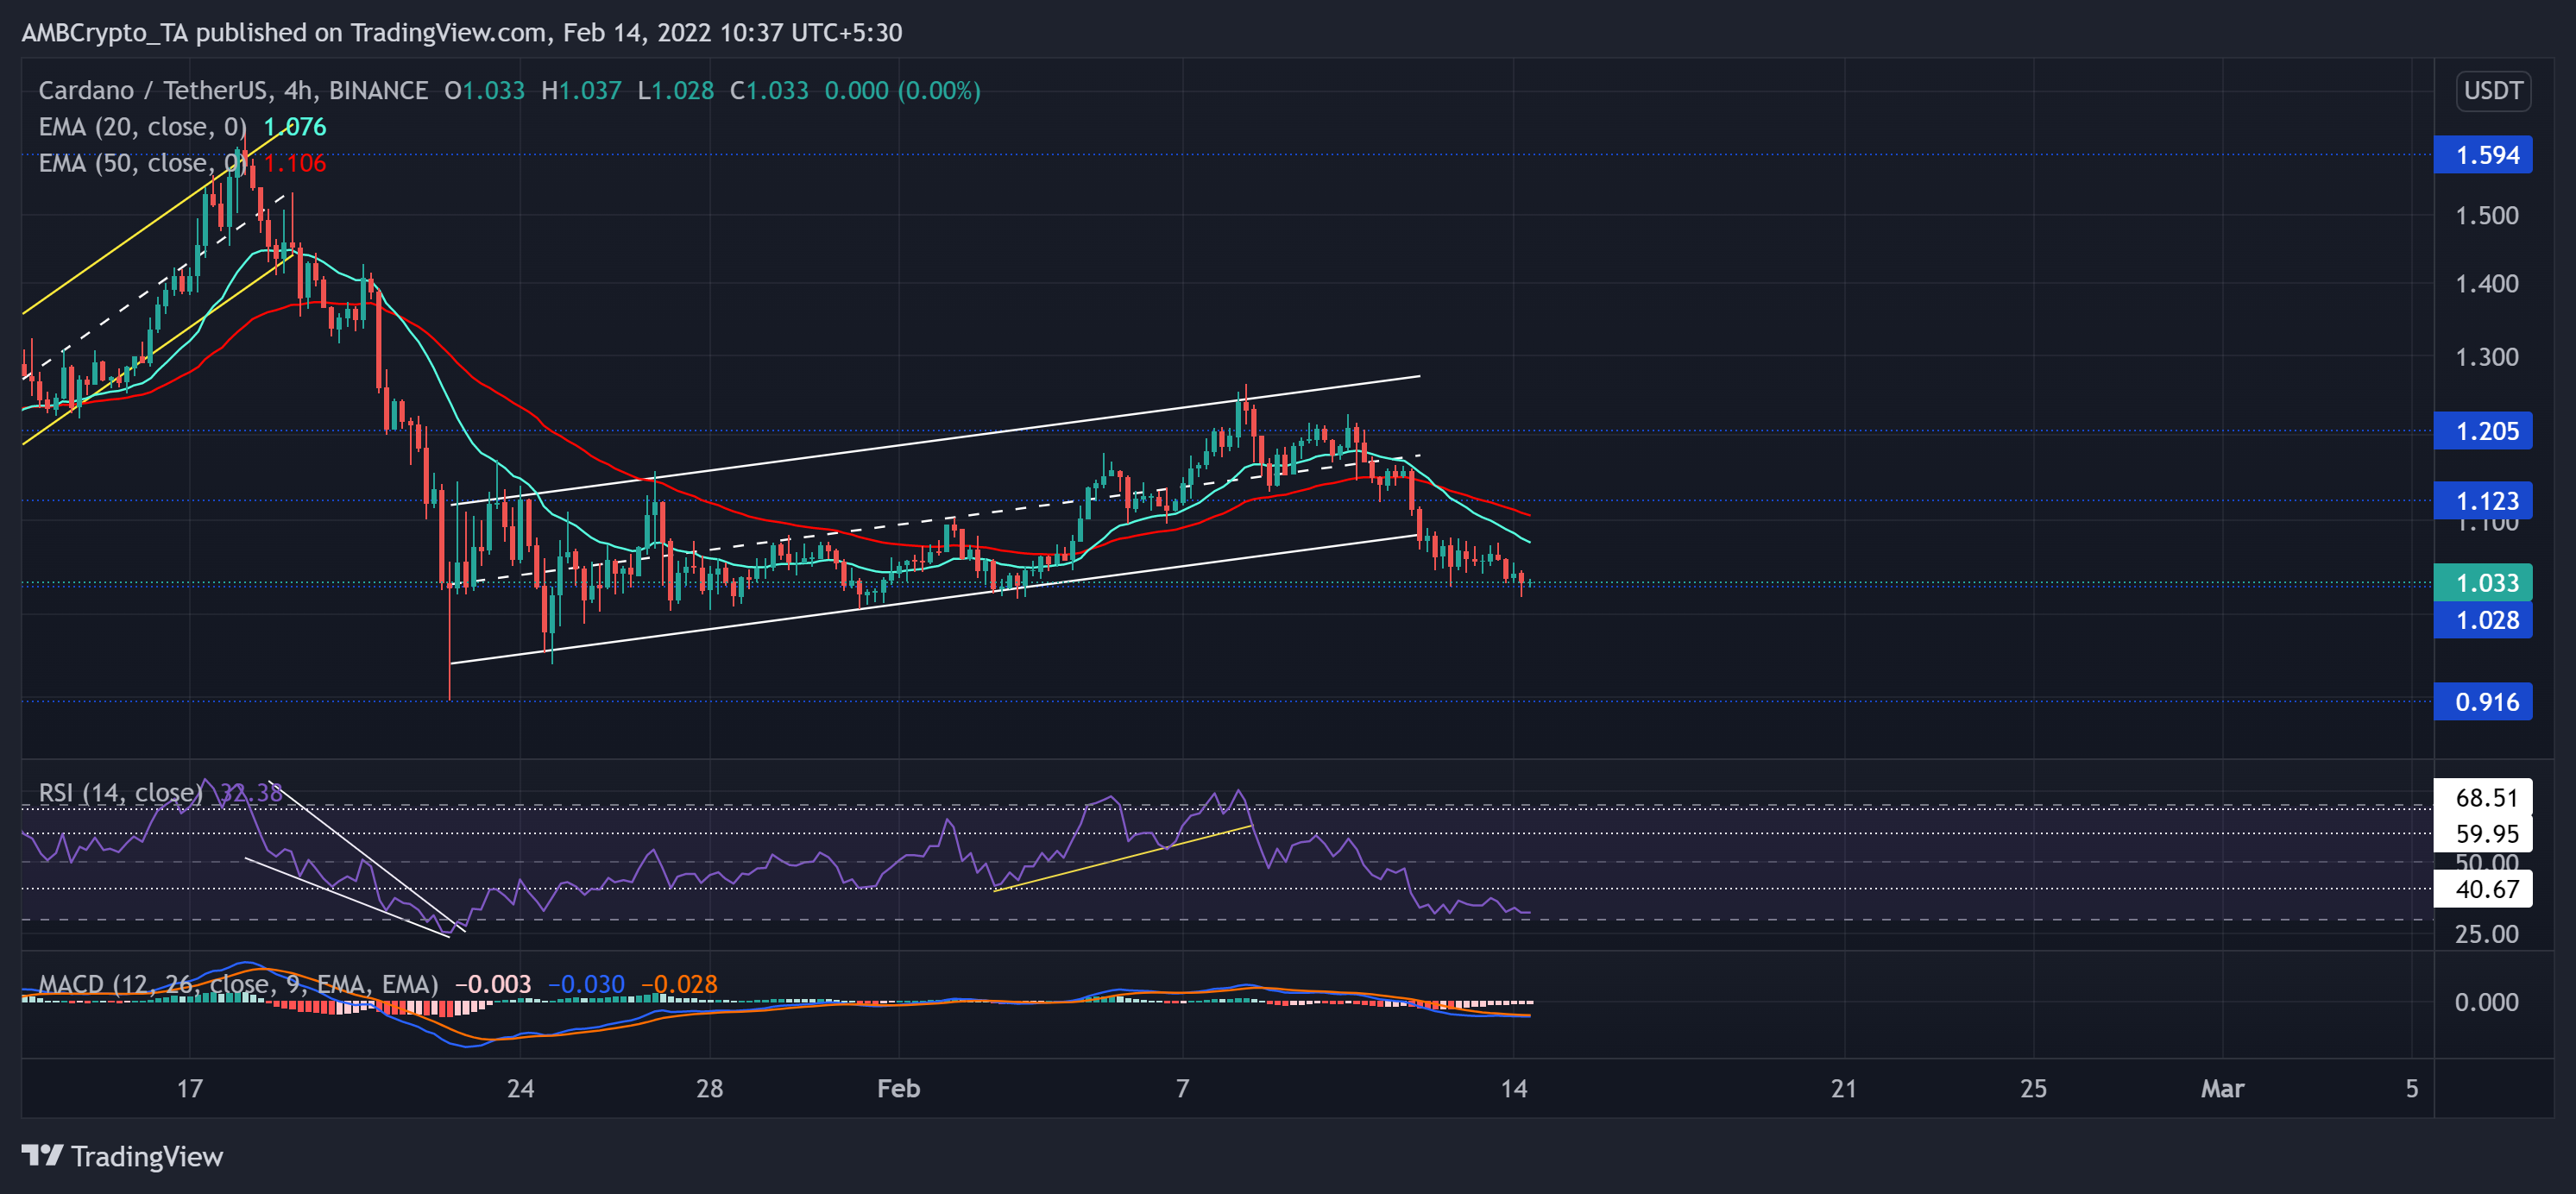
After touching its nine-month low on 22 January, ADA saw a 37.2% recovery as it breached the $1.2-mark to test the upper trendline. Since then, the altcoin has lost over 18% of its value in the last six days. Consequently, breaking down from the up-channel (white).
It is crucial to note that the 20 EMA (cyan) plunged below the 50 EMA (red) on 12 February, affirming a bearish edge. Now, the immediate resistance stood near the 20 EMA at $1.07, followed by the $1.1-level.
At press time, ADA was trading at $1.033. Over the past four days, it saw a substantial decrease in buying pressure. The RSI drifted from the 58-region oversold territory. Any bullish resurgence would propel a test of the 40-mark resistance. Although MACD depicted a bearish preference, its lines were on the verge of a bullish crossover. They still needed to cross the equilibrium to confirm a possible recovery.
Terra (LUNA)
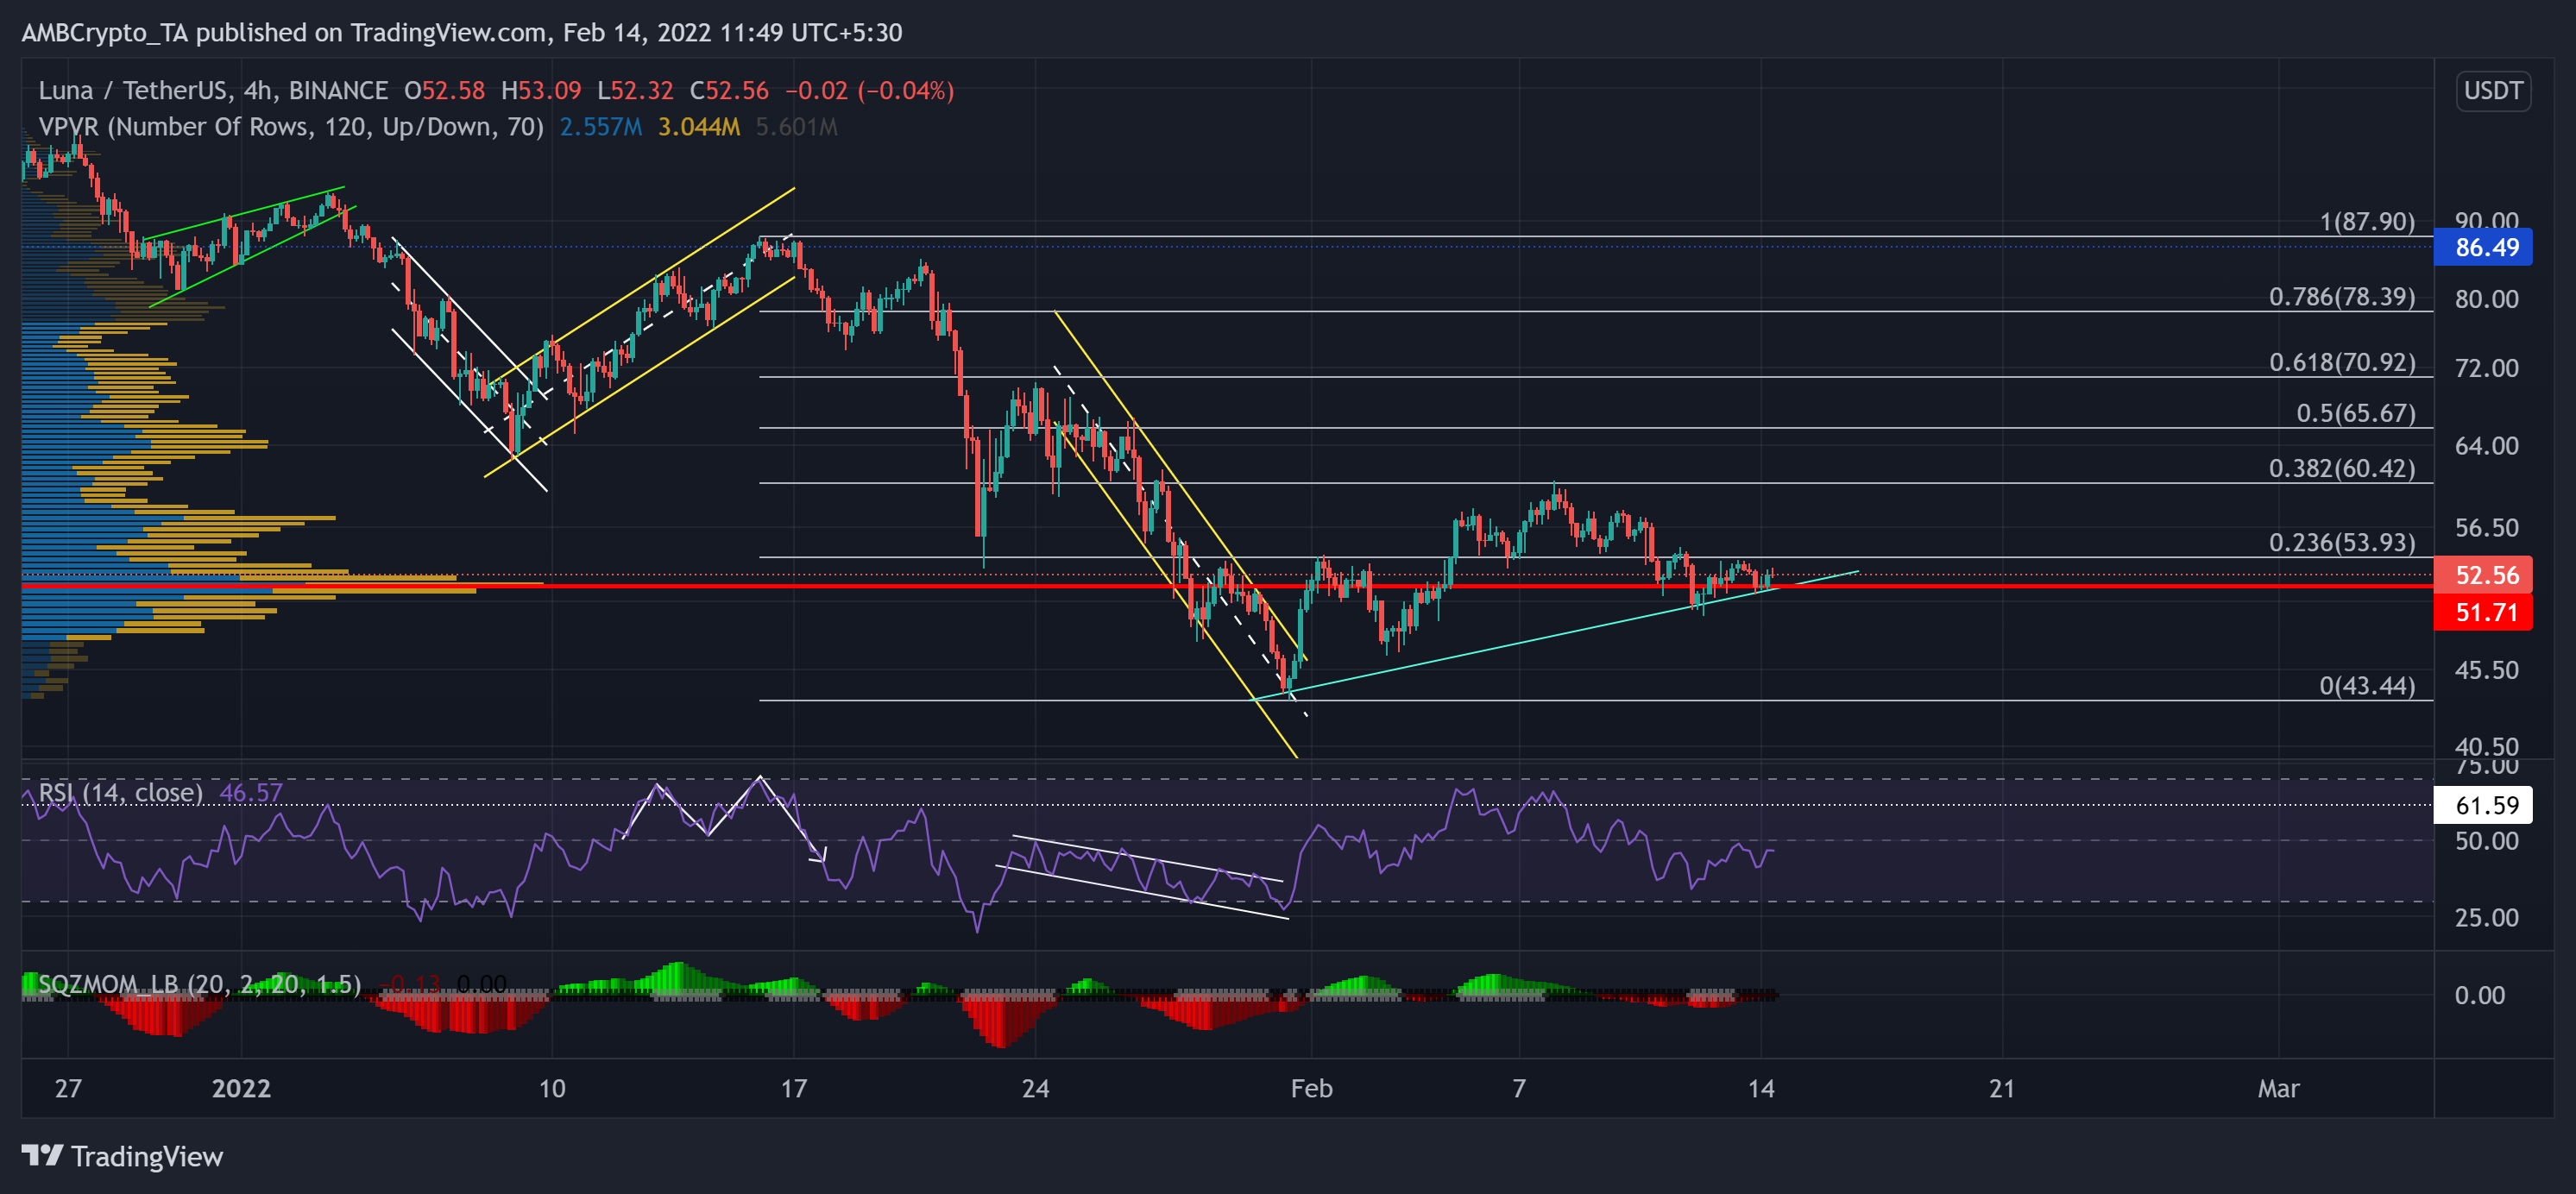
The $86.49-level resistance stood solid as the alt saw an up-channel (yellow) breakdown. Post that, LUNA saw a 50.11% fall (from 17 January) toward its two-month low on 31 January.
Post that, the alt noted 37.4% gains in the next week as it broke out of the down-channel (yellow) only to find resistance at the 38.2% Fibonacci level. As a result, it pulled back and found support at its Point of Control (red) that coincided with the trendline support (cyan). Now, the testing point for the bulls stood at the $53-mark.
At press time, LUNA traded at $52.56. The RSI was weak at the 46-mark while the midline hurdle still stood sturdy. Any close above the equilibrium would brighten the chances of toppling the 23.6% level. Further, the Squeeze Momentum Indicator displayed black dots, revealing a low volatility phase in the near term.
The Sandbox (SAND)
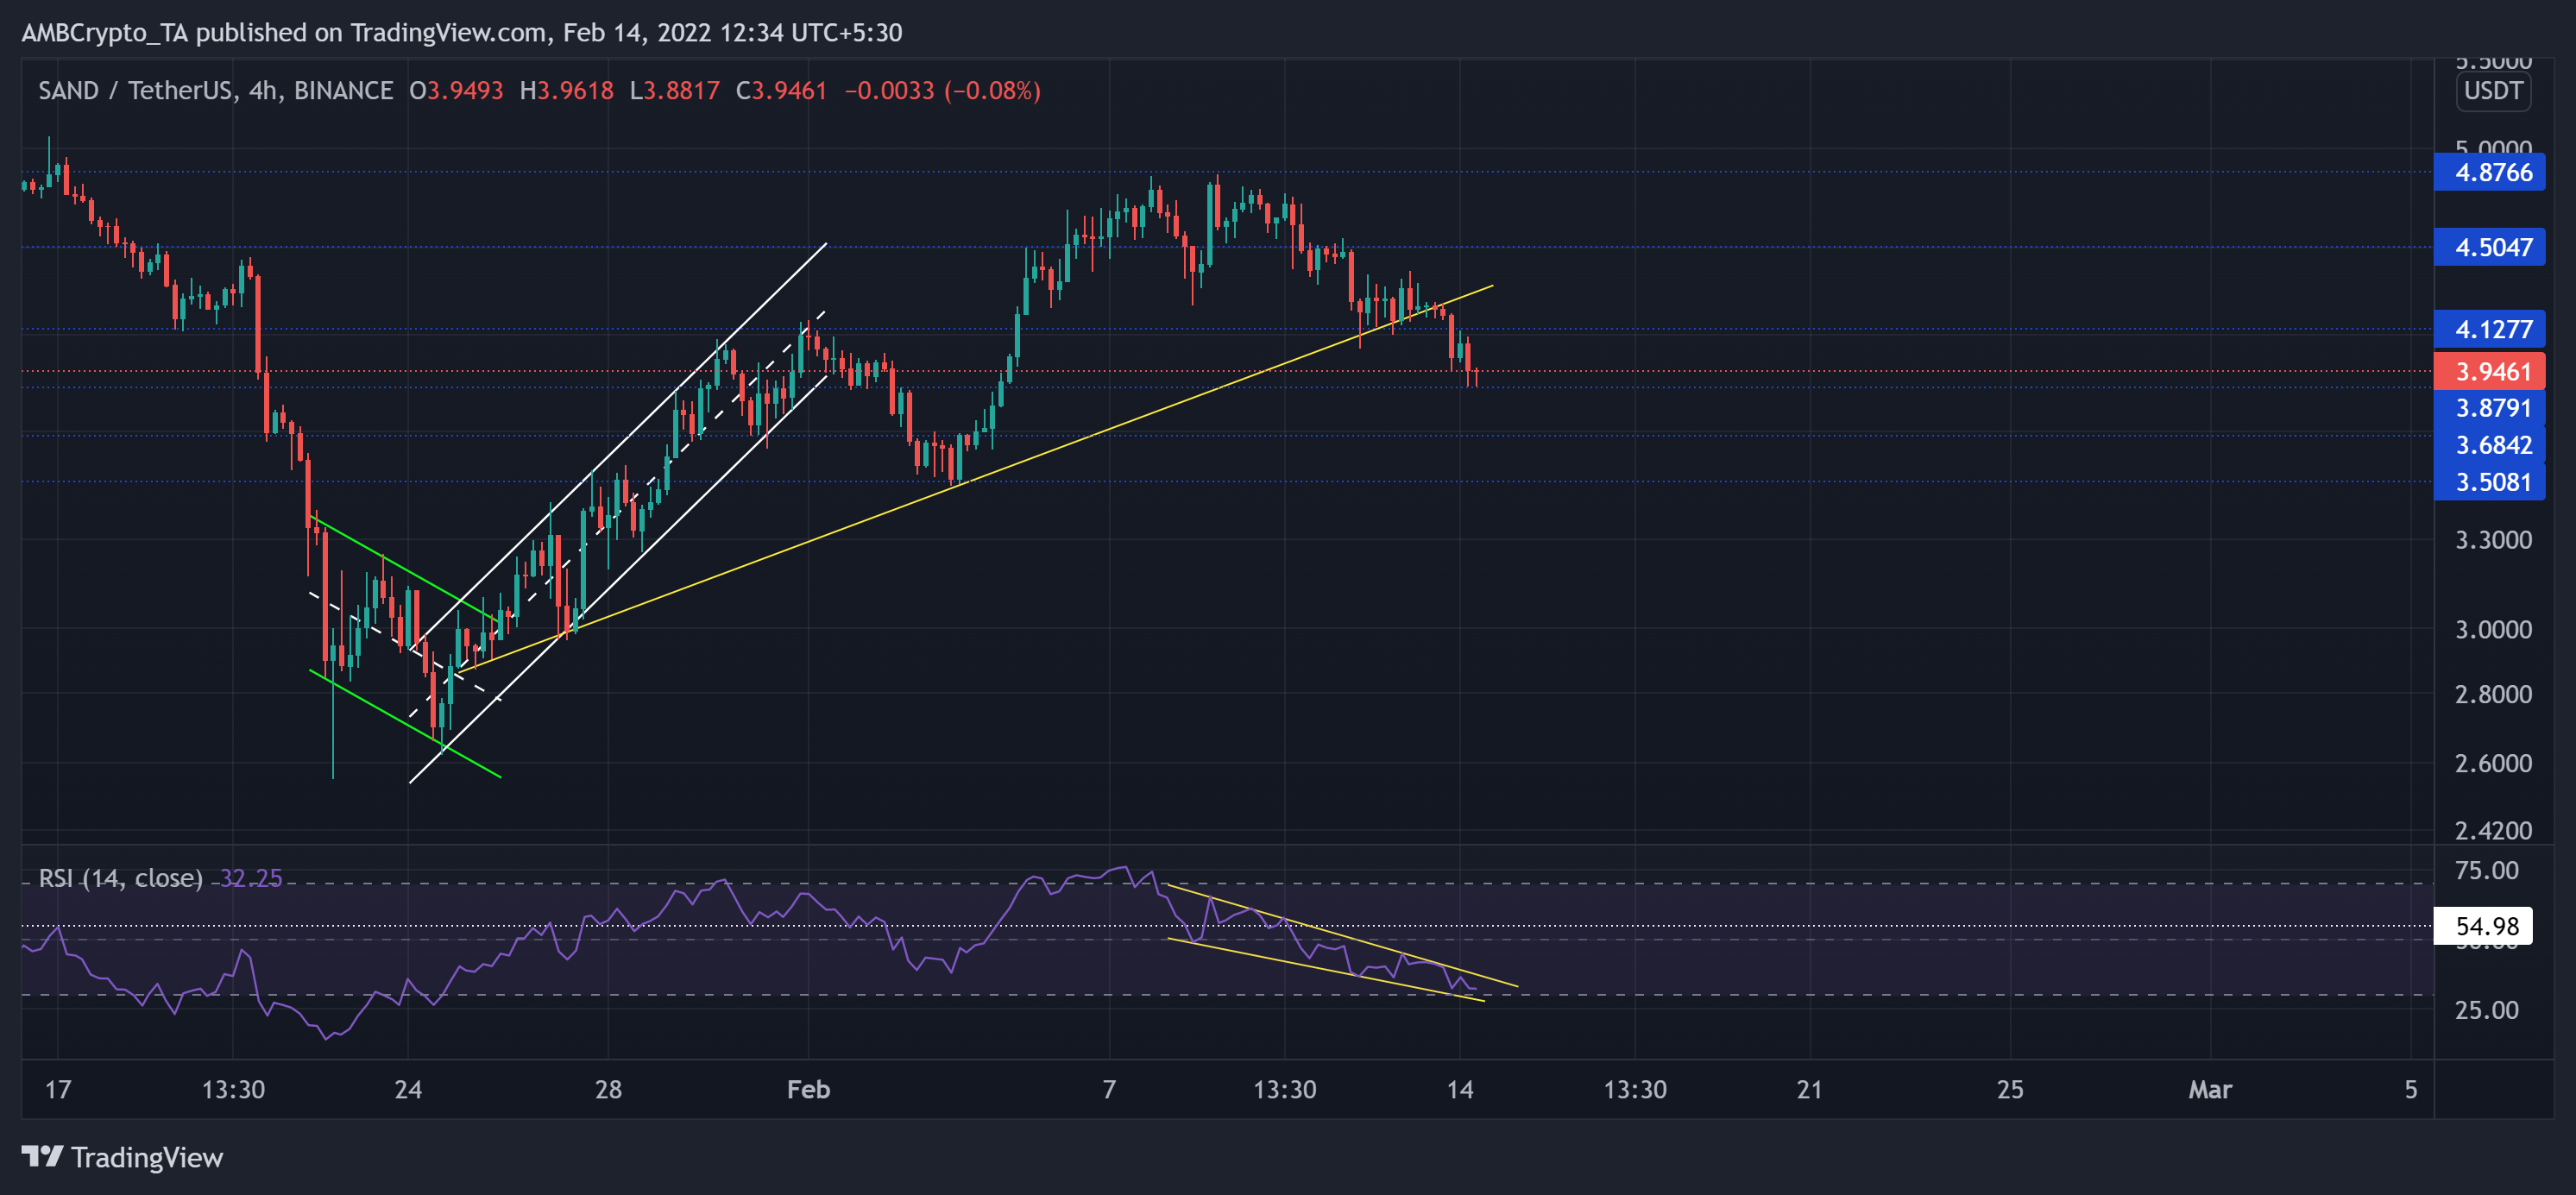
The alt saw an over 62% ROI from its two-month low on 22 January until the $4.12-level. The up-channel rally could not breach this mark as the bears initiated a breakdown.
Since then, SAND has tested its three-week trendline support until breaching it on 13 February. It flipped the $4.12-level from support to immediate resistance. The immediate testing point for the bulls stood at the $3.8-mark.
At press time, SAND traded at $3.9461. The RSI steeply dropped in a falling wedge (yellow). As it hovered into the oversold region, a reversal would be likely if the buyers show conviction to defend the $3.8-level.