- Cardano, at press time, was range-bound but it cleared a significant short-term resistance
- Daily active addresses have held up well, despite the price’s downtrend since April
In an earlier report, it was revealed that 76.59% of Cardano [ADA] holders were out of the money. These statistics appeared healthier when looking at holders around its press time market price.
Source: IntoTheBlock
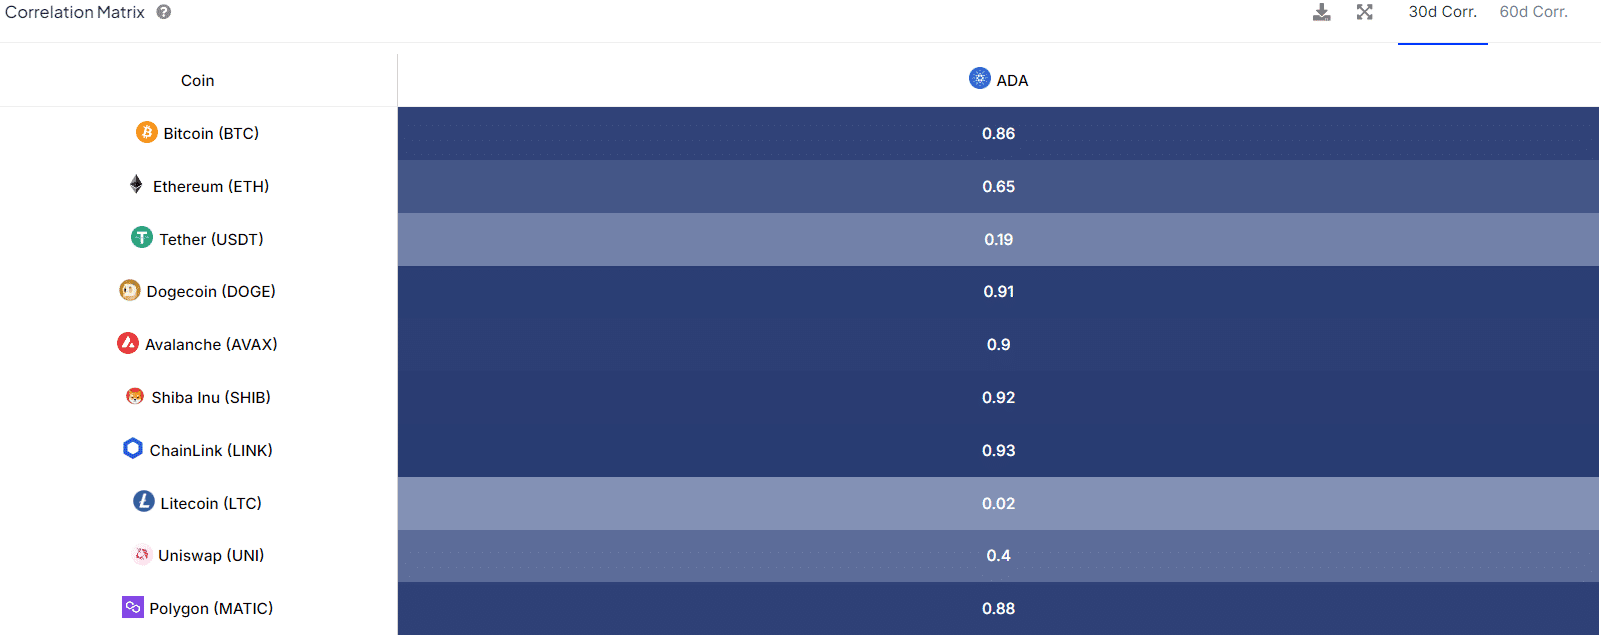
The +0.86 correlation to Bitcoin [BTC] means ADA traders must also keep an eye on the king coin. The correlation with Ethereum [ETH] is positive but weaker, which is slightly good news because ETH’s performance has been poor lately.
Outlining key levels for Cardano
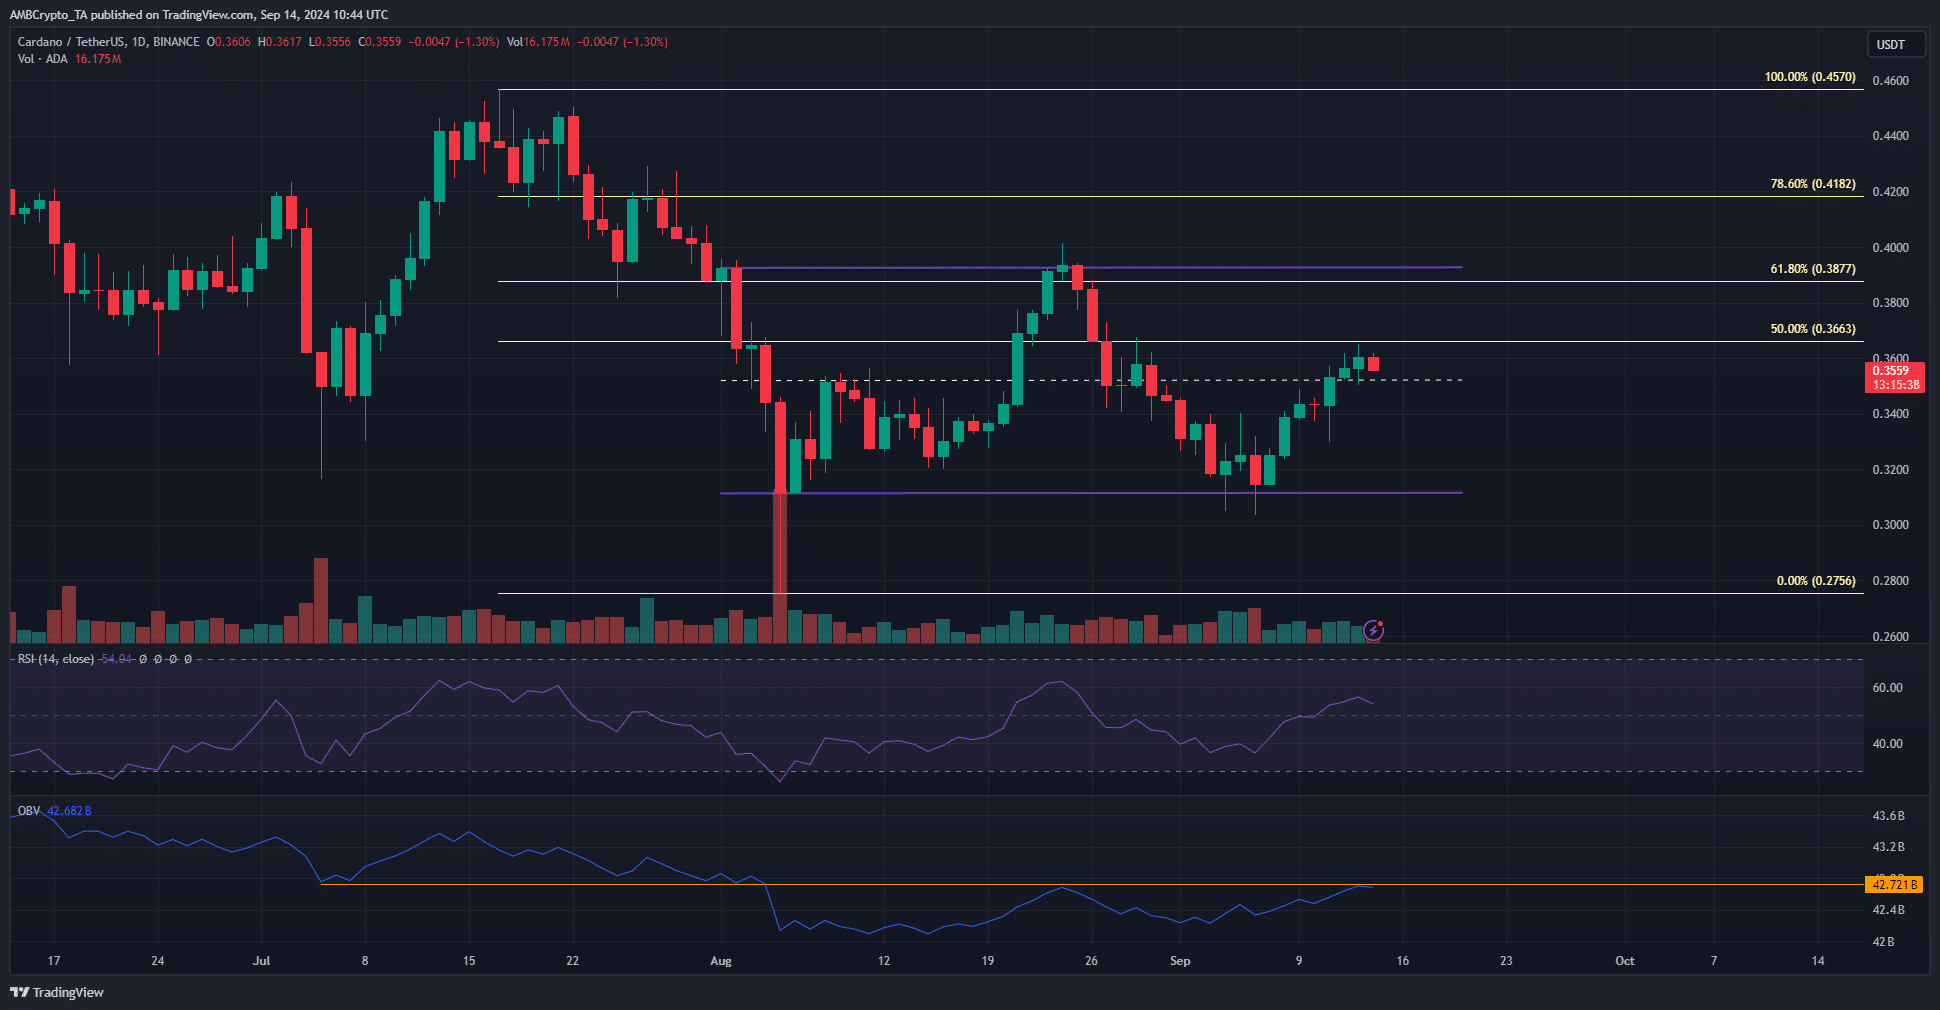
Source: ADA/USDT on TradingView
Cardano’s price action has also been uninspired recently, with a range formation from $0.311-$0.393 being in play since early August. The mid-range level at $0.352 was broken a couple of days ago, and the bulls should be able to defend the retest as support.
The OBV has trended higher slowly over the past month and seemed to be on the verge of setting a new high. The daily RSI also signaled a bullish momentum shift. Hence, ADA traders can anticipate a rally towards $0.39-$0.4 on the charts.
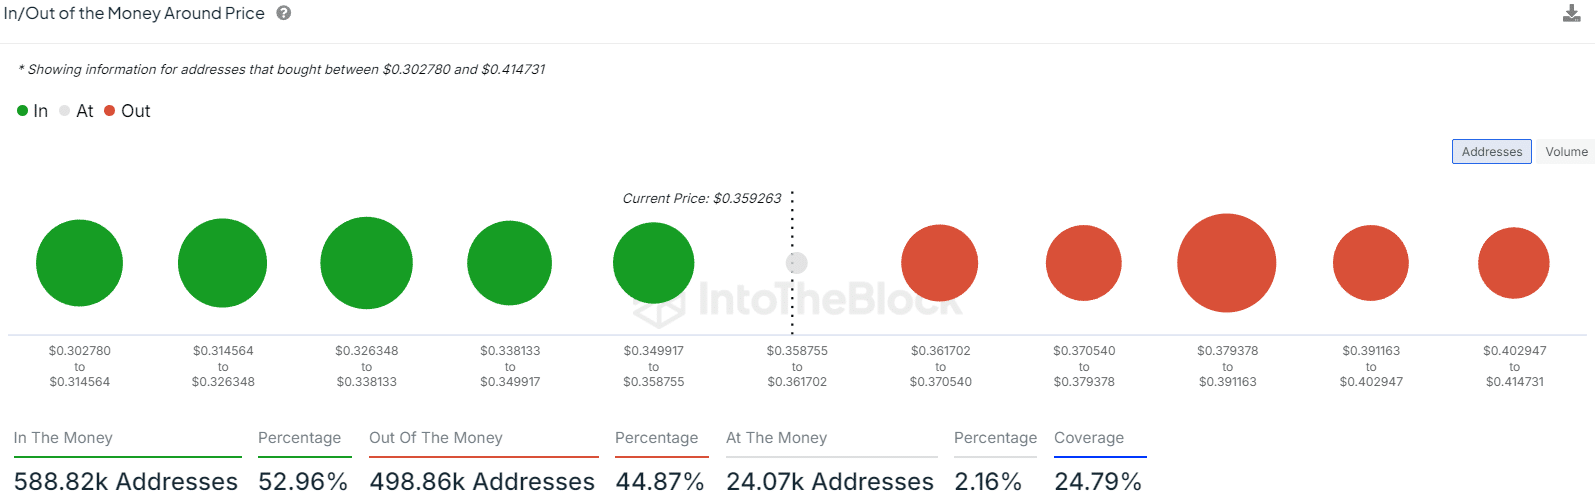
Source: IntoTheBlock
A look at the in/out of the money stats around the price revealed that $0.326-$0.338 and $0.35-$0.358 are key short-term support zones. Meanwhile, the $0.379-$0.391 level is a stern supply zone. These findings line up pretty well with the price action chart.
On-chain metrics reveal potential market bottom
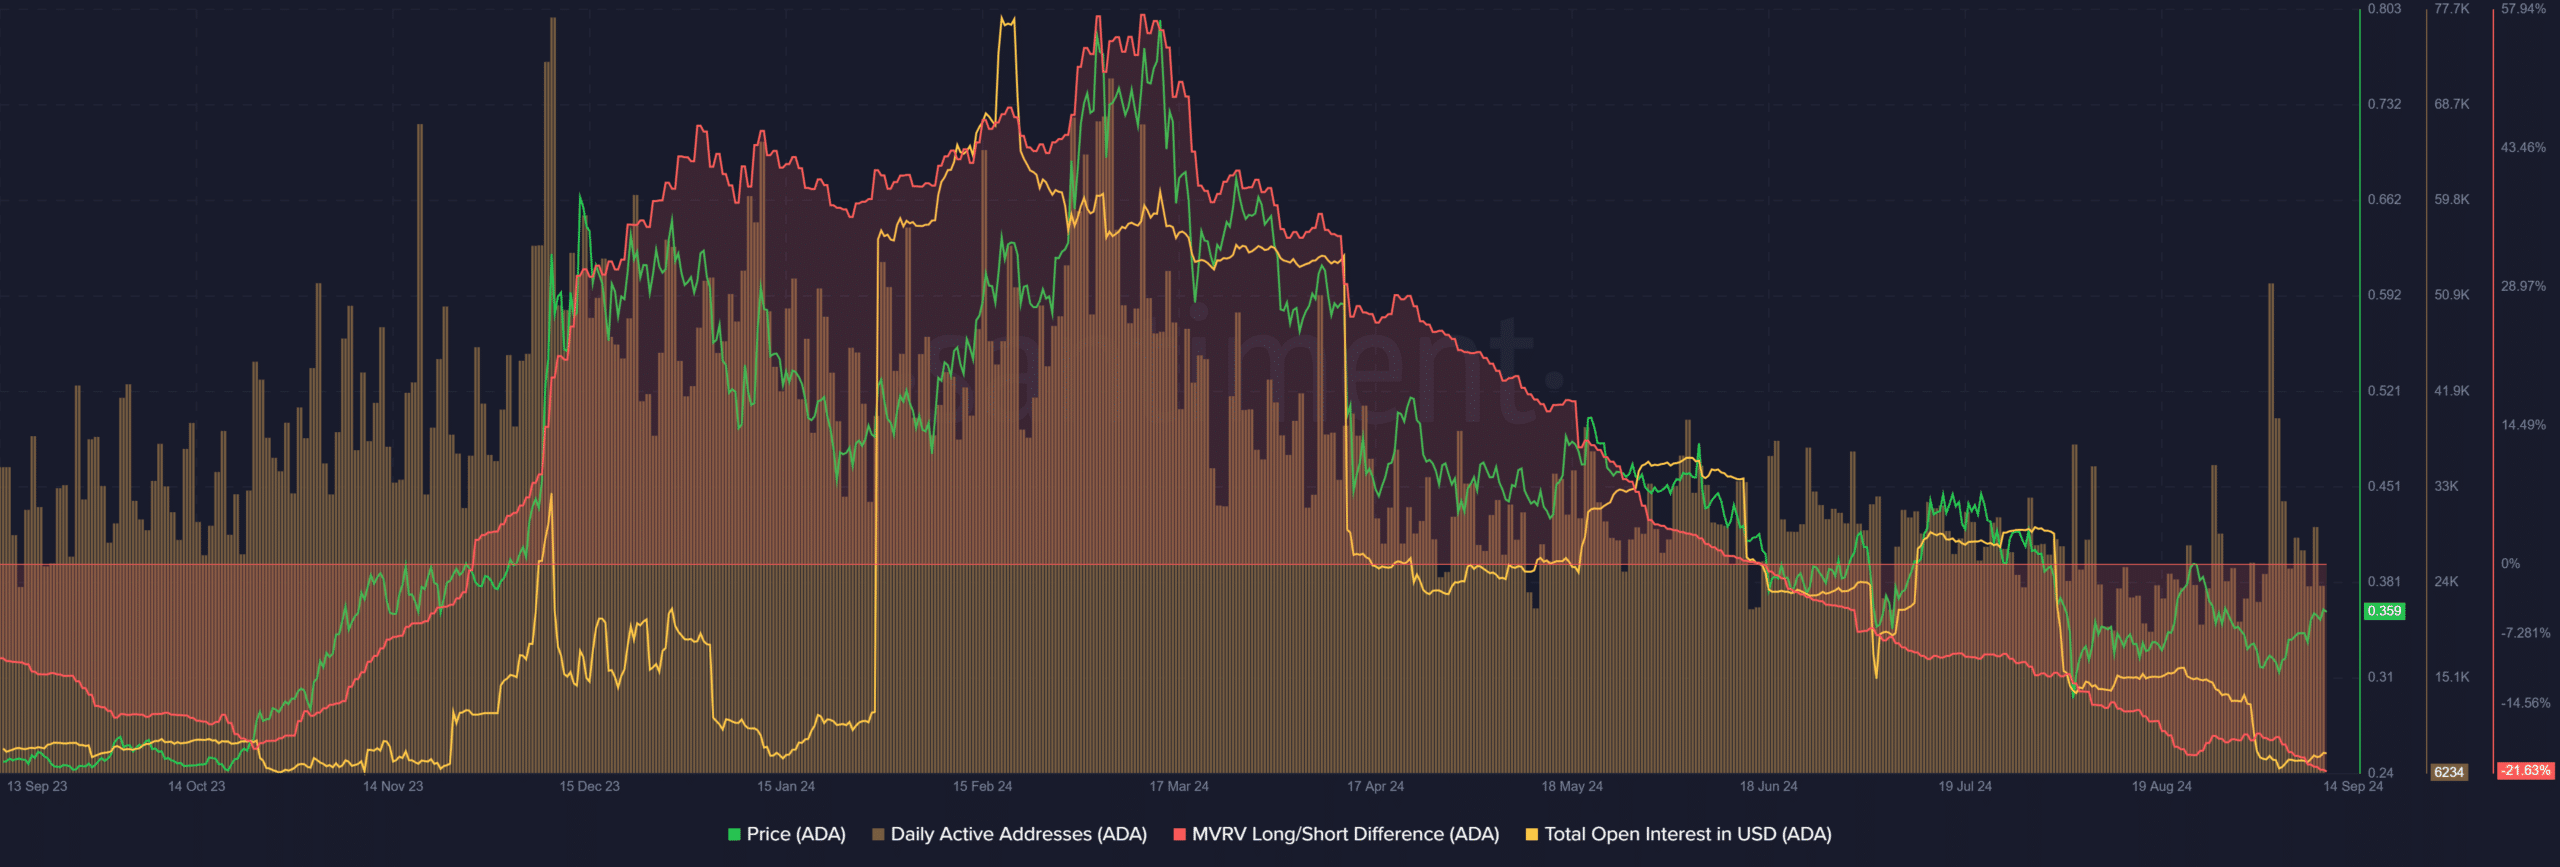
Source: Santiment
The MVRV long/short difference is the difference between the 365-day MVRV and 60-day MVRV. Hence, negative values mean that long-term holders are at a big loss, compared to short-term holders.
This metric has fallen below the low it set in October 2023. This means that a potential market bottom may now be underway for Cardano. At the same time, the daily active addresses metric has been relatively stable since April, despite the price downtrend.
To put it simply, network participation may be poised for gains should the market sentiment and price trends turn bullish. Additionally, the falling Open Interest showed that speculators have not been convinced of a strong rally yet.
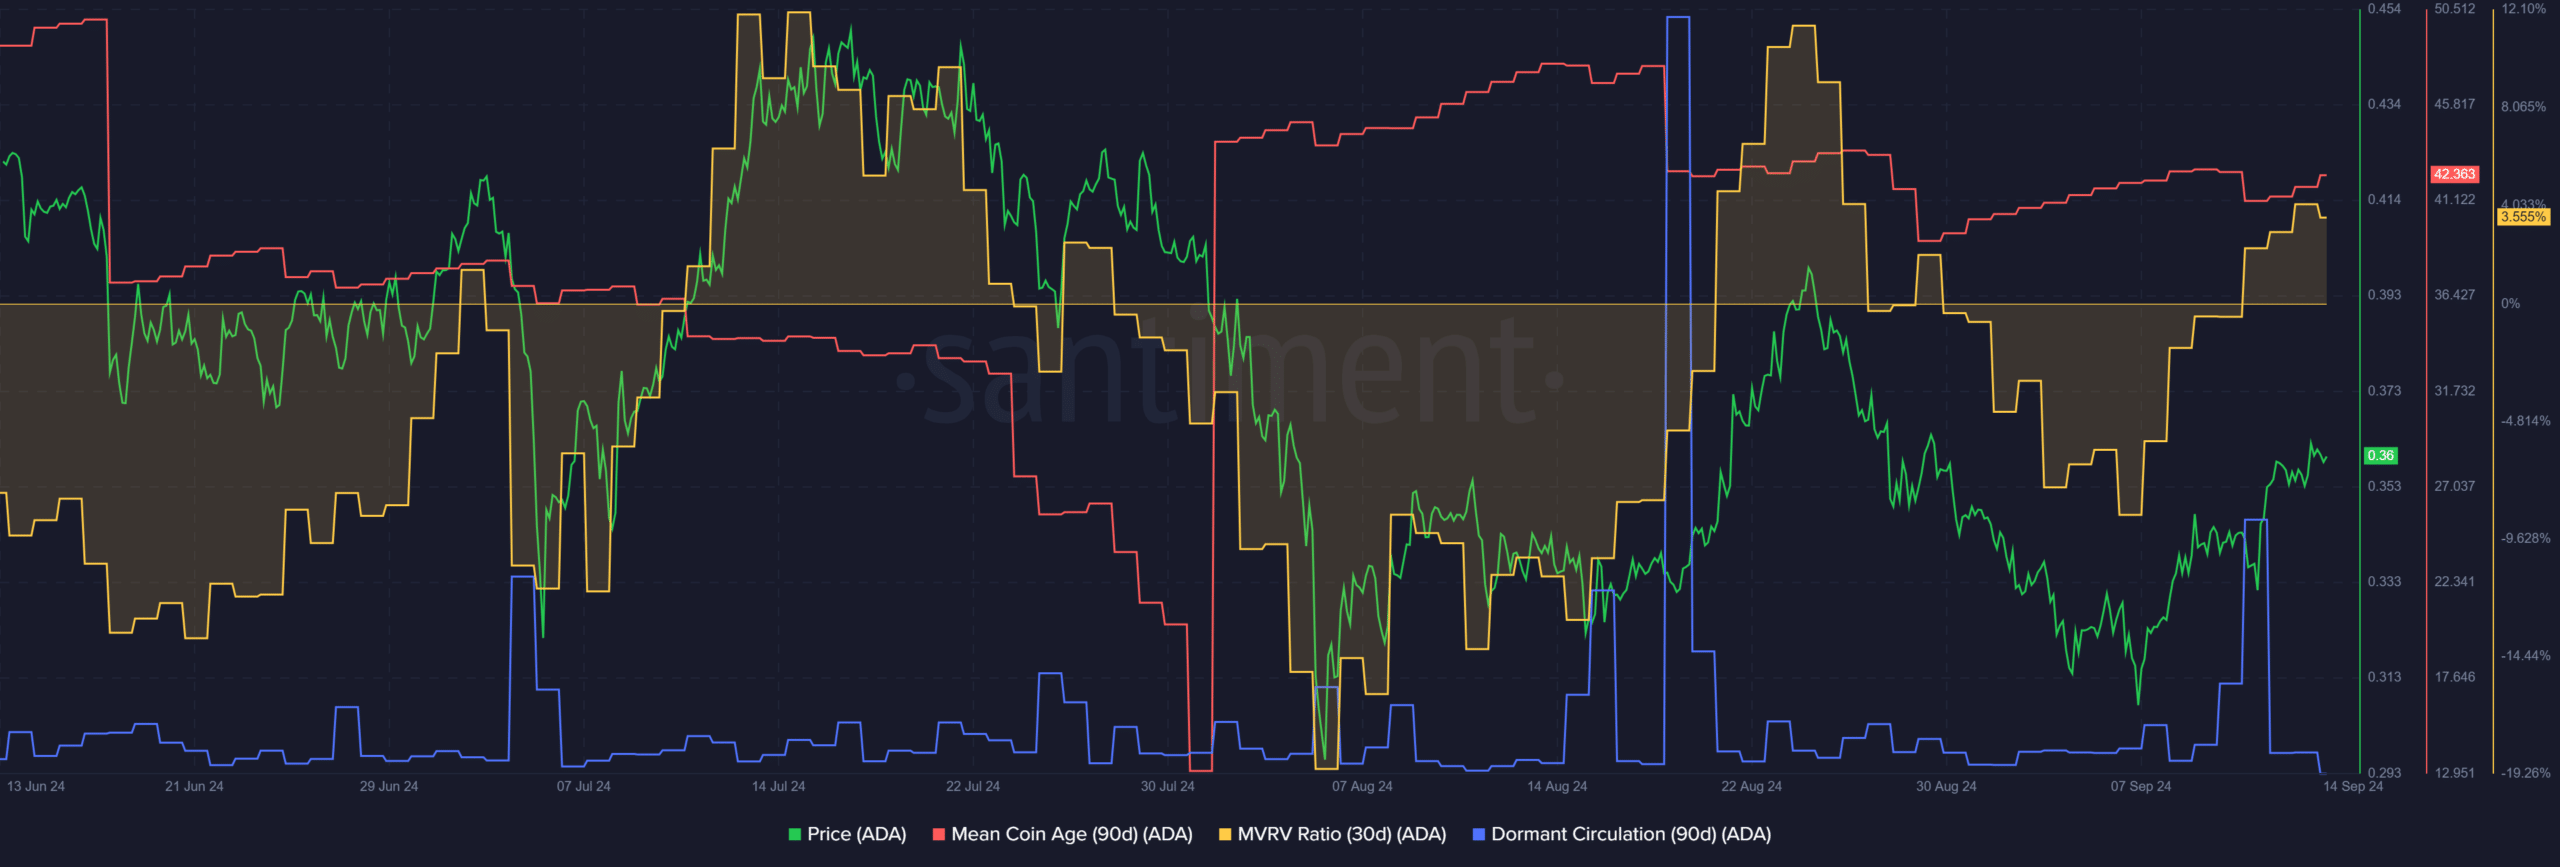
Source: Santiment
While Cardano might be near a long-term market bottom, in the short term, the token can be interpreted to be slightly overvalued. At press time, the 30-day MVRV was positive and showed that there is a chance of selling pressure from profit-taking activity.
Is your portfolio green? Check the Cardano Profit Calculator
Also, the mean coin age lacked a significant trend but, it crept higher over the past three weeks. The dormant circulation spike on 11 September saw a short-term price dip, but ADA was quick to recover then.