- ADA’s price trended bearishly, with consistent lower highs and numerous double-top formations.
- A tight Bollinger Bands and a flat MACD point to low volatility.
Despite weak performance over the past month, Cardano [ADA] showed signs of strong support, as on-chain data indicates.
Moreover, the network has seen an uptick in total value locked (TVL) in DeFi applications, reaching levels twice its peak during the 2021 bull market.
IntoTheBlock data shows that only 30% of ADA holders are currently in profit, which means a significant portion of the market is experiencing losses.
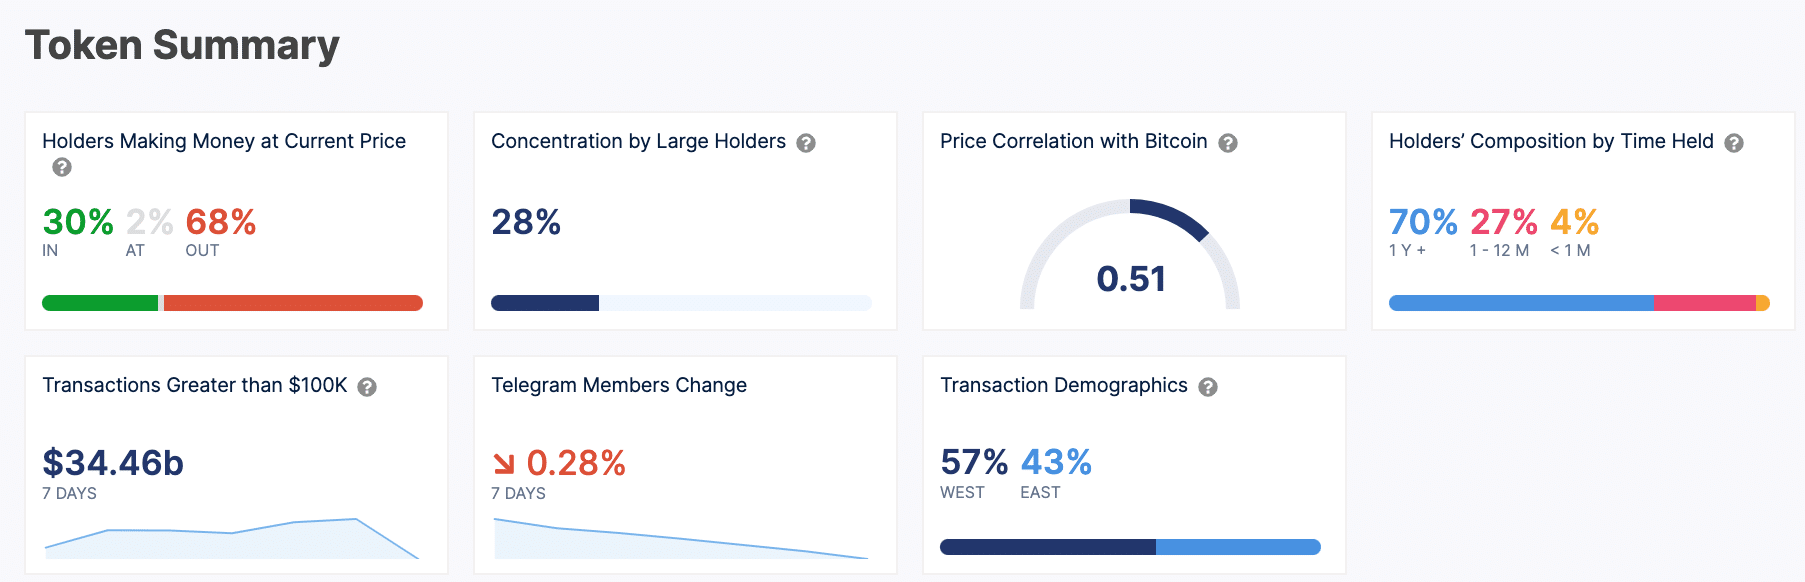
Source: IntoTheBlock
With 28% of ADA held by large investors, the token shows a moderately high level of whale control, which might influence price stability and potential manipulation risks.
Of ADA’s large scale investors
Over the past week, the enormous volume of $34.46 billion in large transactions highlights massive institutional or large-scale investor movements, which could be both inflows and outflows, reflecting active high-stake engagements in ADA.
ADA’s price showed a declining trend at press time, which was particularly noticeable from the consistent lower highs from the start of June. This trend aligned with the bearish sentiment.
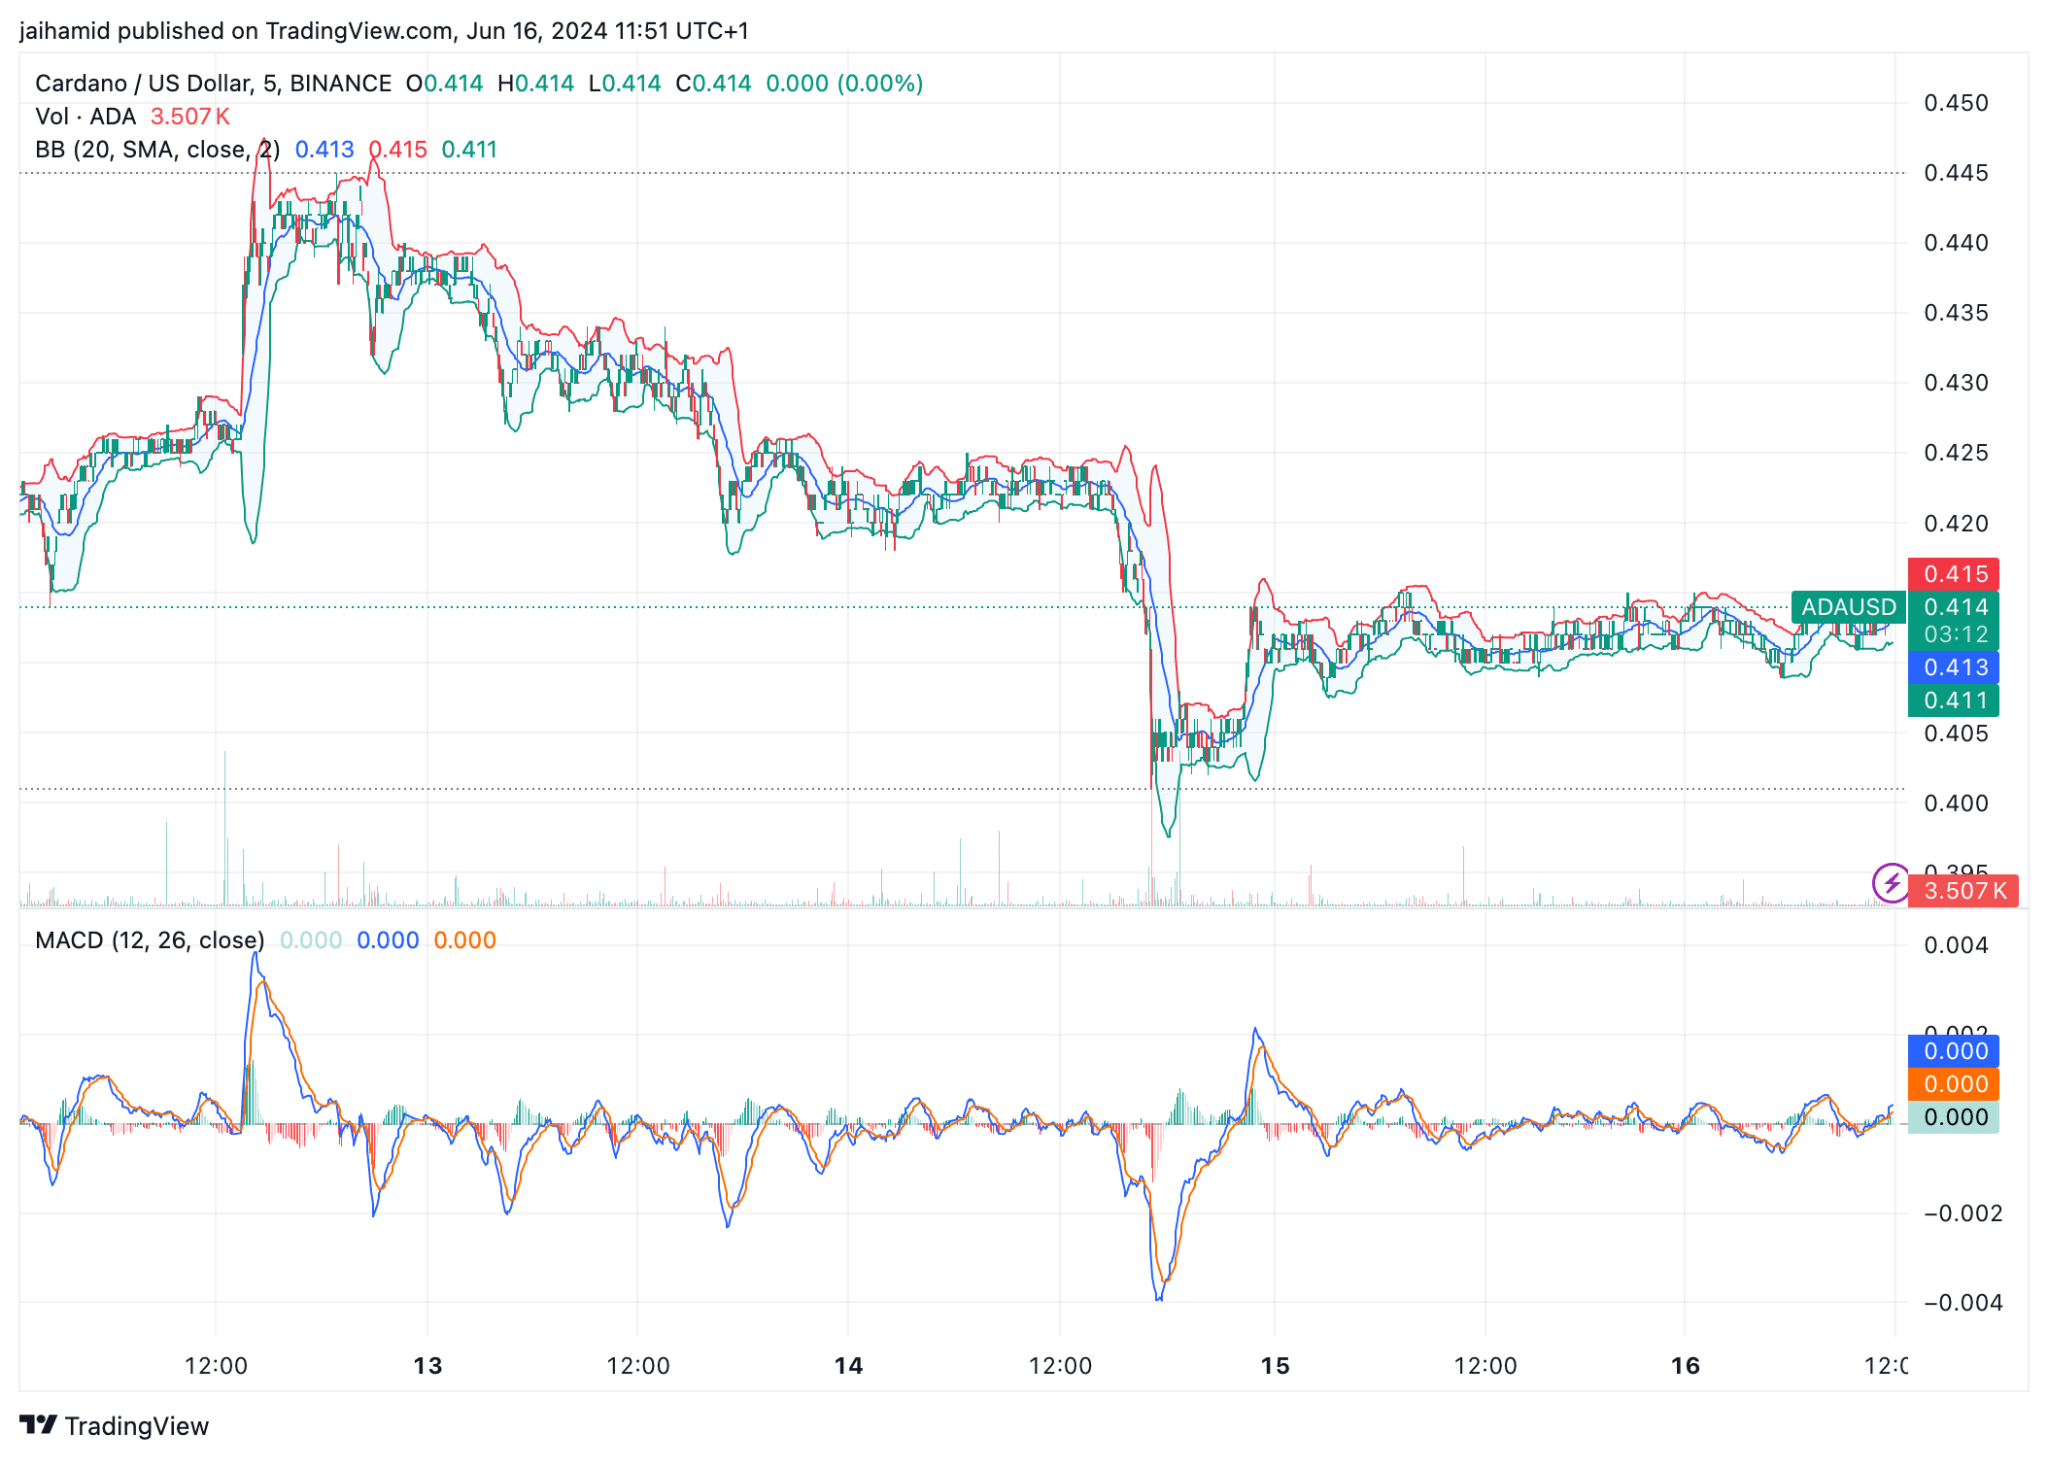
Source: TradingView
The Bollinger Bands on this chart are relatively tight, often suggesting low volatility.
ADA’s price is oscillating closely around the middle band, showing a lack of major bullish or bearish momentum, consistent with a consolidation phase.
The Moving Average Convergence Divergence (MACD) was flatlining at zero, reinforcing the bands’ sentiment.
There were numerous double-top formations across the chart below, typically recognized as bearish reversal indicators.
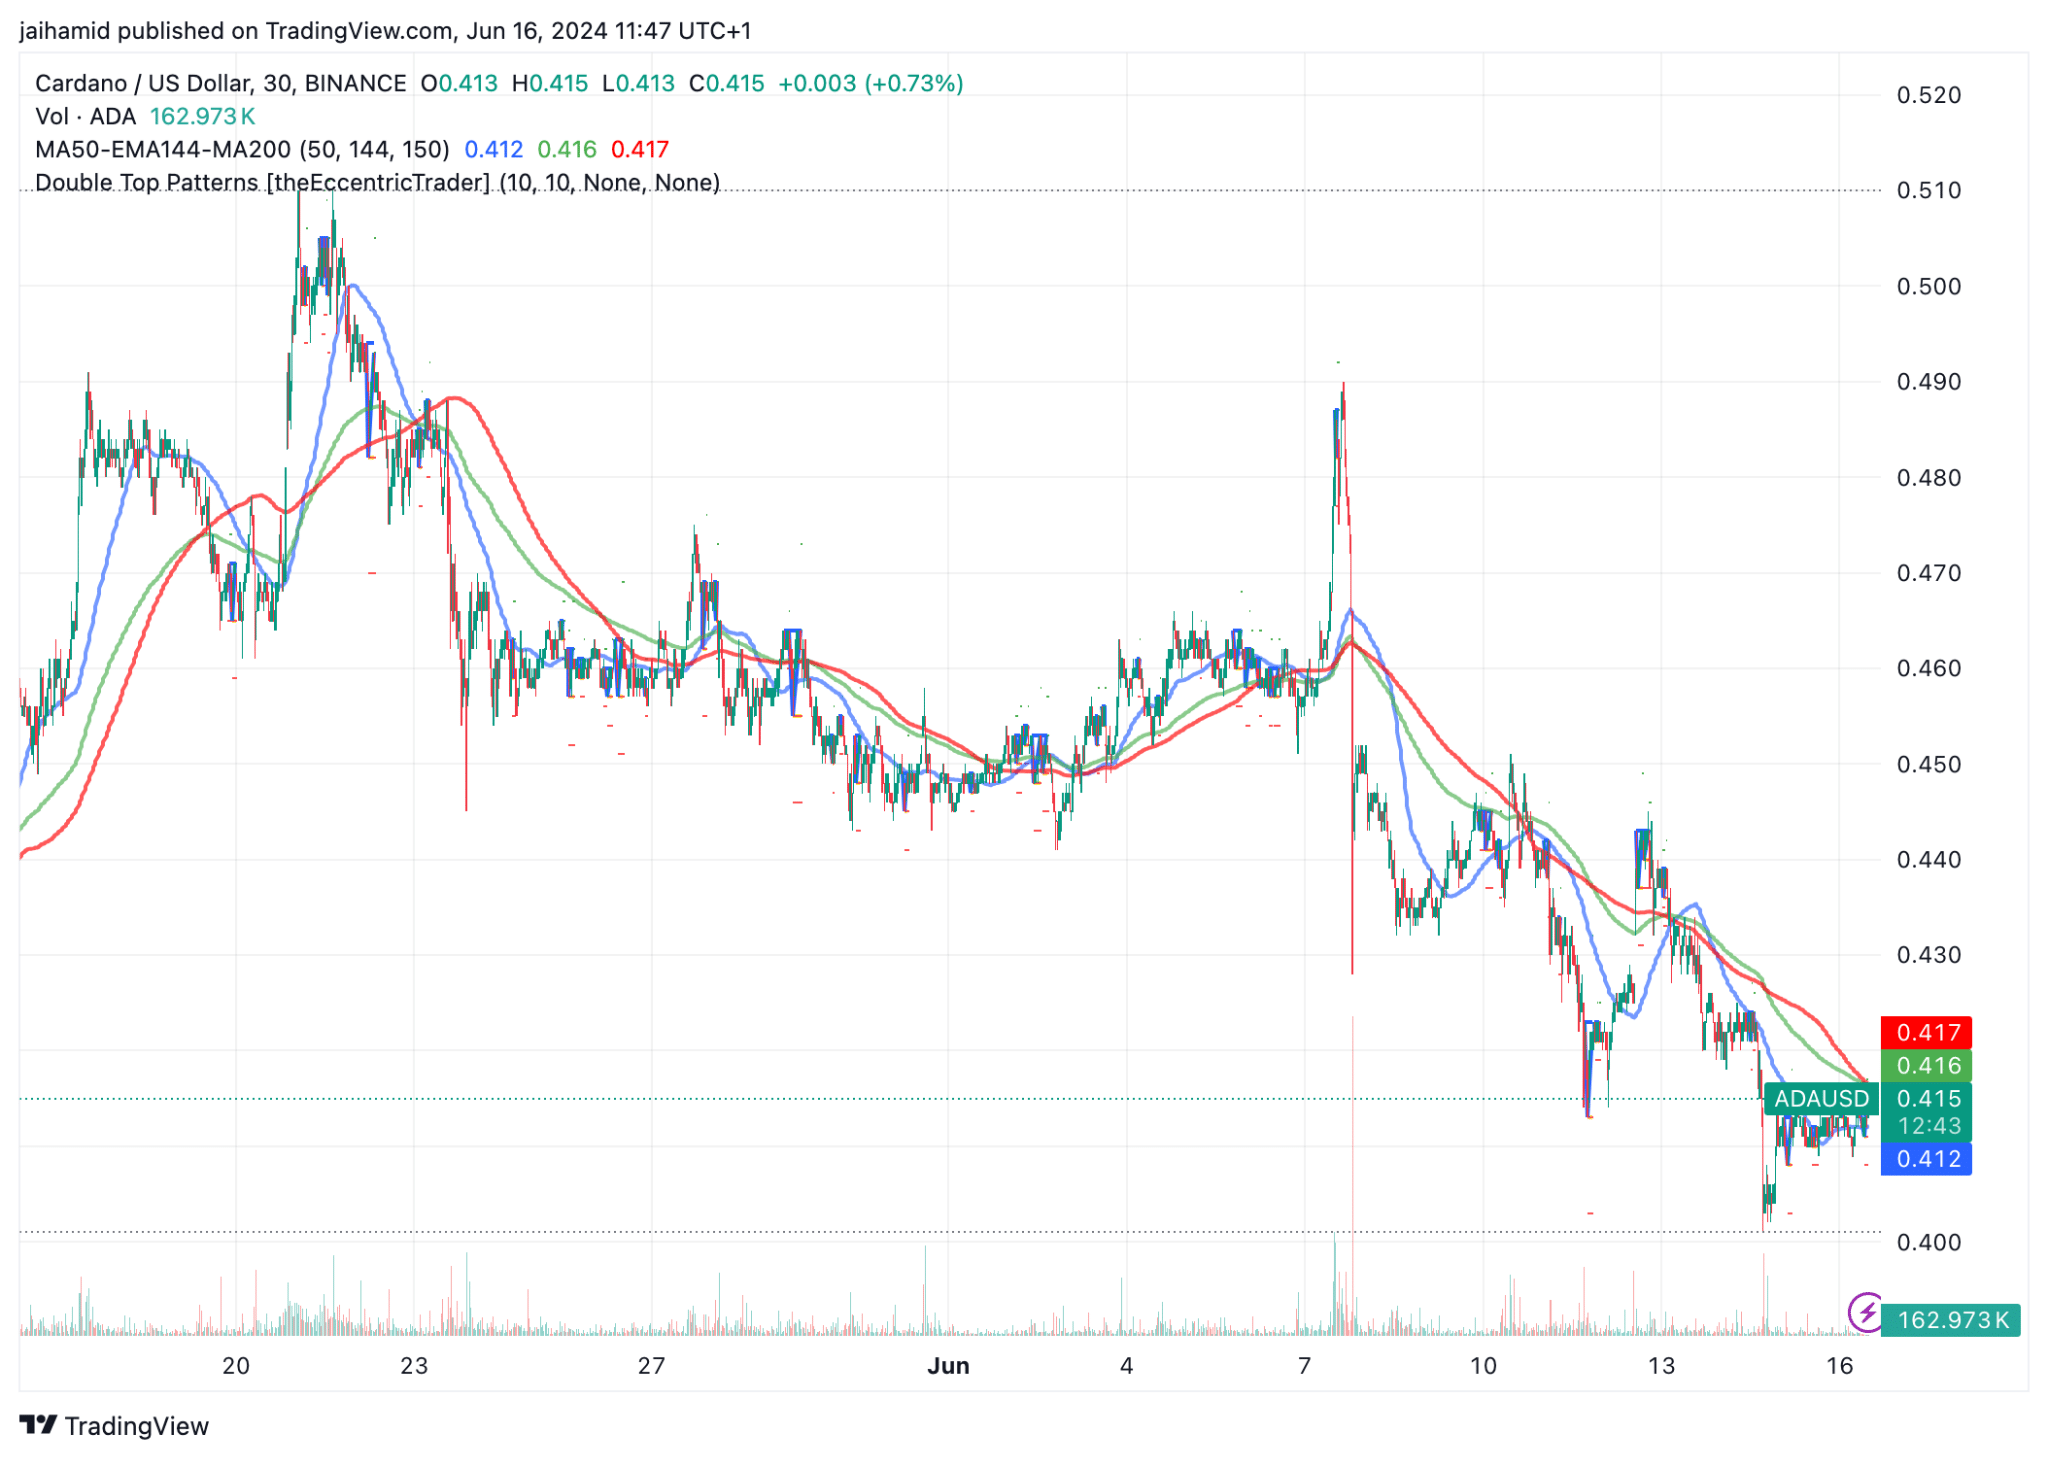
Source: TradingView
Moreover, ADA’s price was below all the moving averages, which can be considered a bearish signal. When the price is below these lines, they generally suggest that the overall momentum is downward.
ADA’s price has fluctuated between higher resistance points and lower support levels.
Is your portfolio green? Check out the ADA Profit Calculator
The chart shows that each time ADA attempts to recover, it faces resistance and fails to establish a new high, conforming instead to lower peaks, which outline the double-top patterns.
Interestingly, the RSI oscillates between 50 and 60, indicating a neutral market with a slight lean toward bullish sentiment.


![Solana [SOL] gains on Ethereum [ETH] but faces sell-off risks](https://ambcrypto.com/wp-content/uploads/2025/04/5B92B32E-5F8B-49F6-94A3-D0086EF6CCA2-400x240.webp)

