Cardano, Polkadot, GALA Price Analysis: 31 January
As Bitcoin re-entered the $37,000-zone, flipping the ‘extreme fear’ sentiment became a mammoth task for the bulls. Consequently, Cardano, Polkadot and GALA witnessed their RSIs fall below the midline while their near-term technicals flash a bearish edge.
Cardano (ADA)
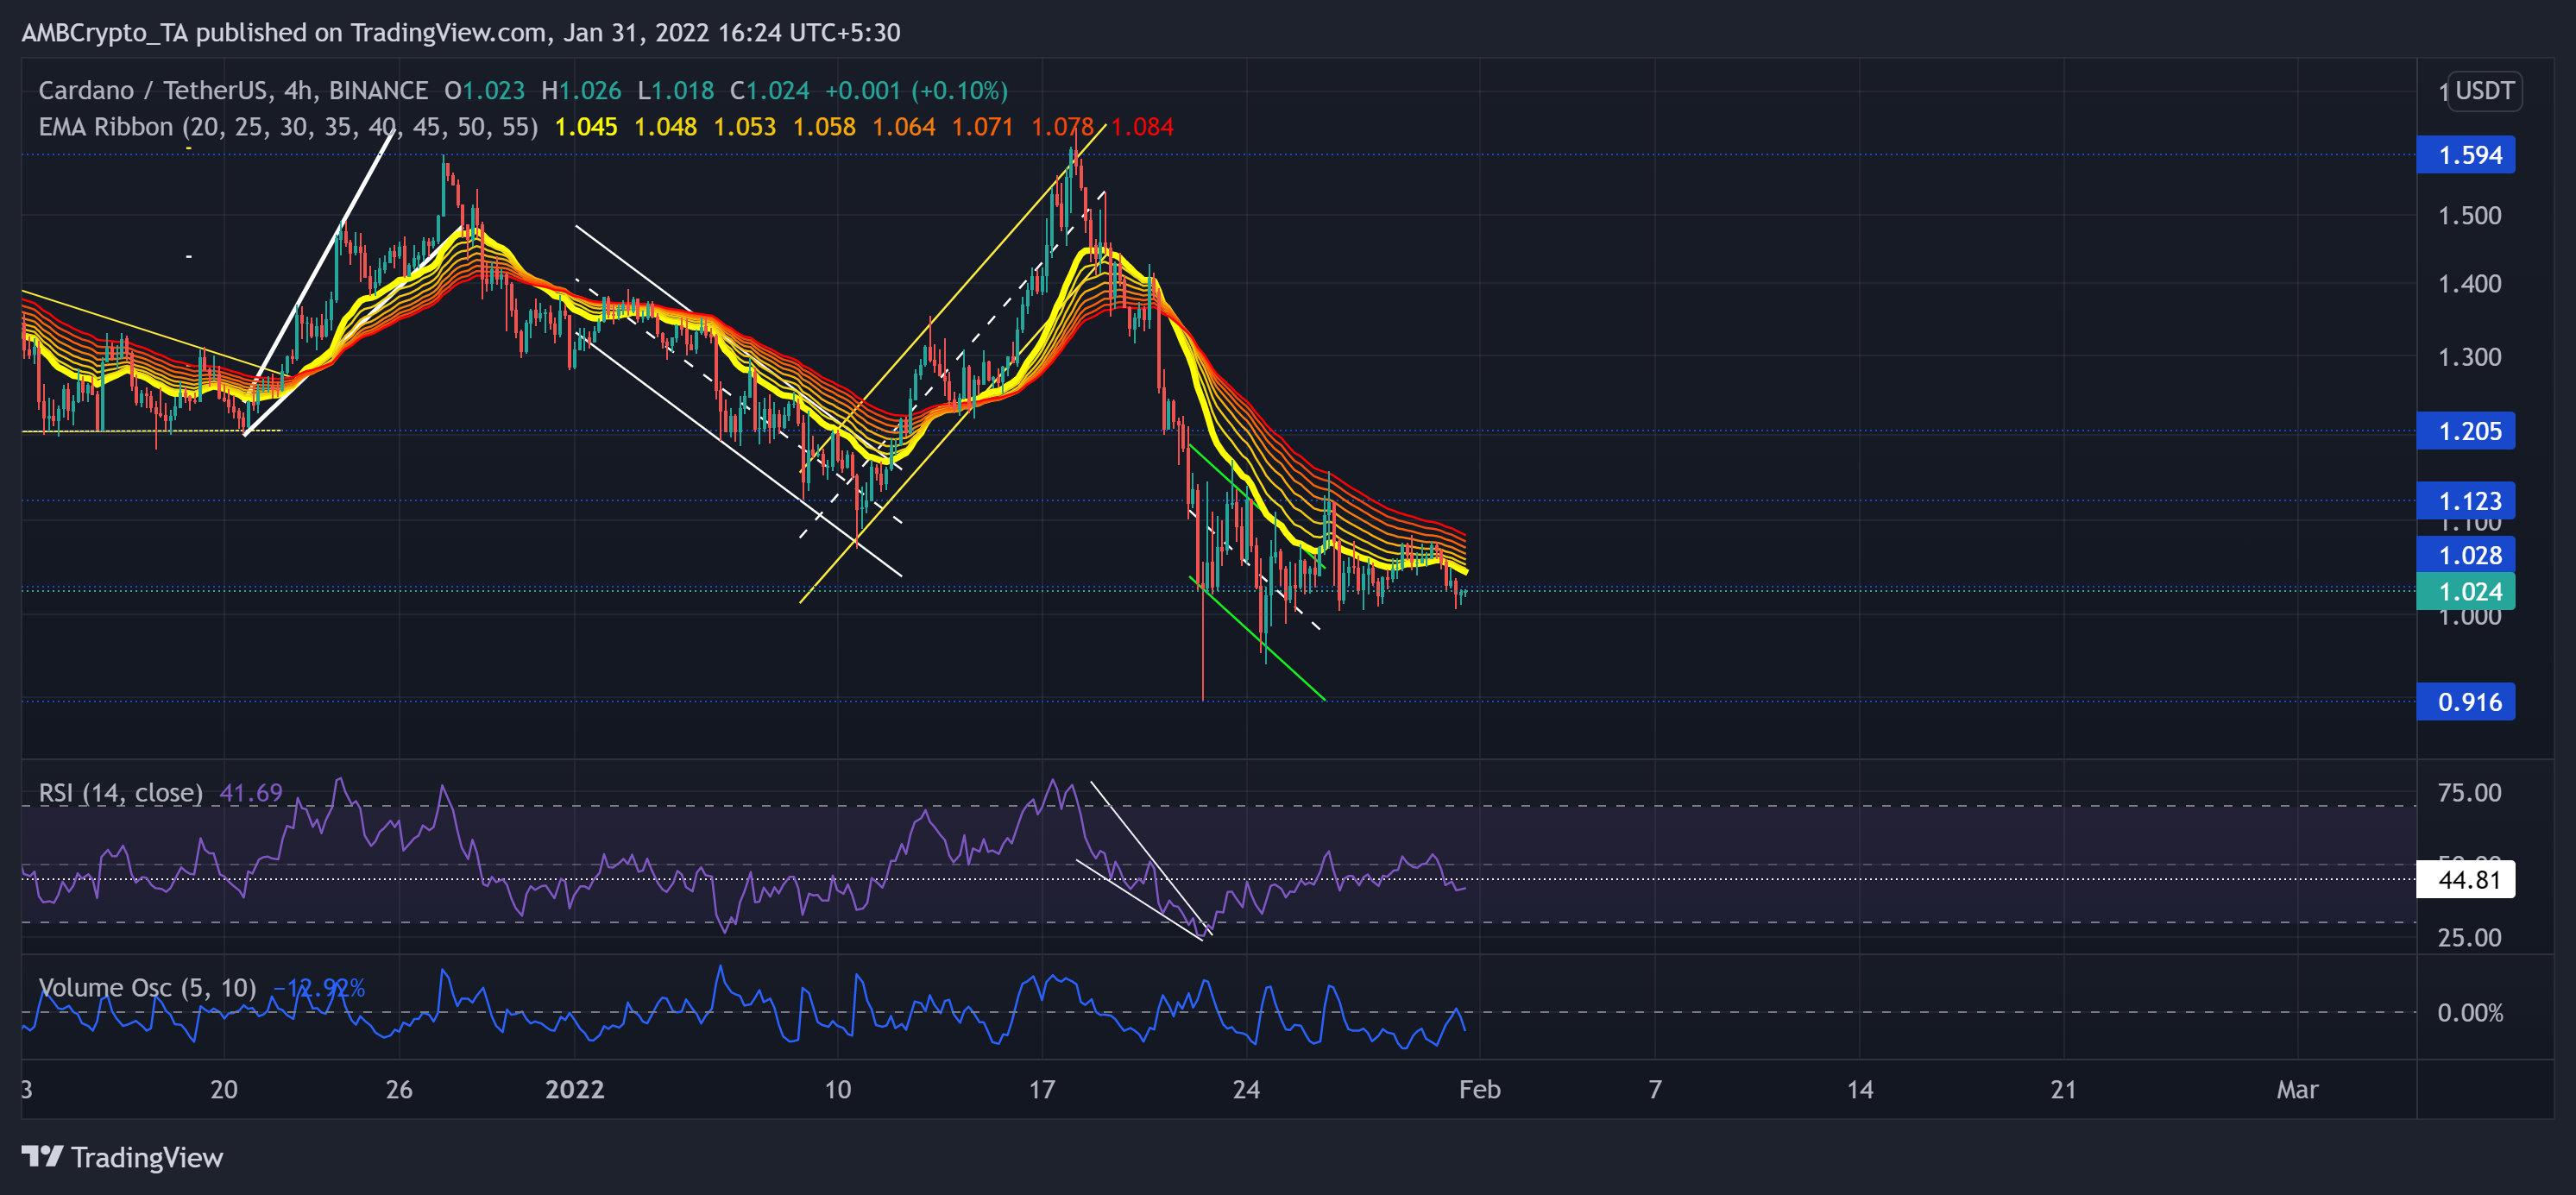
The recent up-channel (yellow) breakdown from the $1.59-mark flipped the crucial $1.12-level from support to resistance. ADA saw a downturn of 44.02% (from 18 January) to hit its nine-month low on 22 January.
Thus, ADA fell below its EMA ribbons and even lost the vital $1.02-mark (immediate resistance). Over the past two days, bulls tested the 40-EMA thrice before plunging below the $1.028-level.
At press time, ADA traded at $1.024. The RSI saw a sharp surge after the falling wedge breakout. It crossed the midline but quickly reversed from the 50-level. Thus, it even lost the 44-mark support (now resistance). Further, The Volume Oscillator still faced a strong barrier at the zero-line. It needed to ramp up its volumes to sustain a strong trend.
Polkadot (DOT)
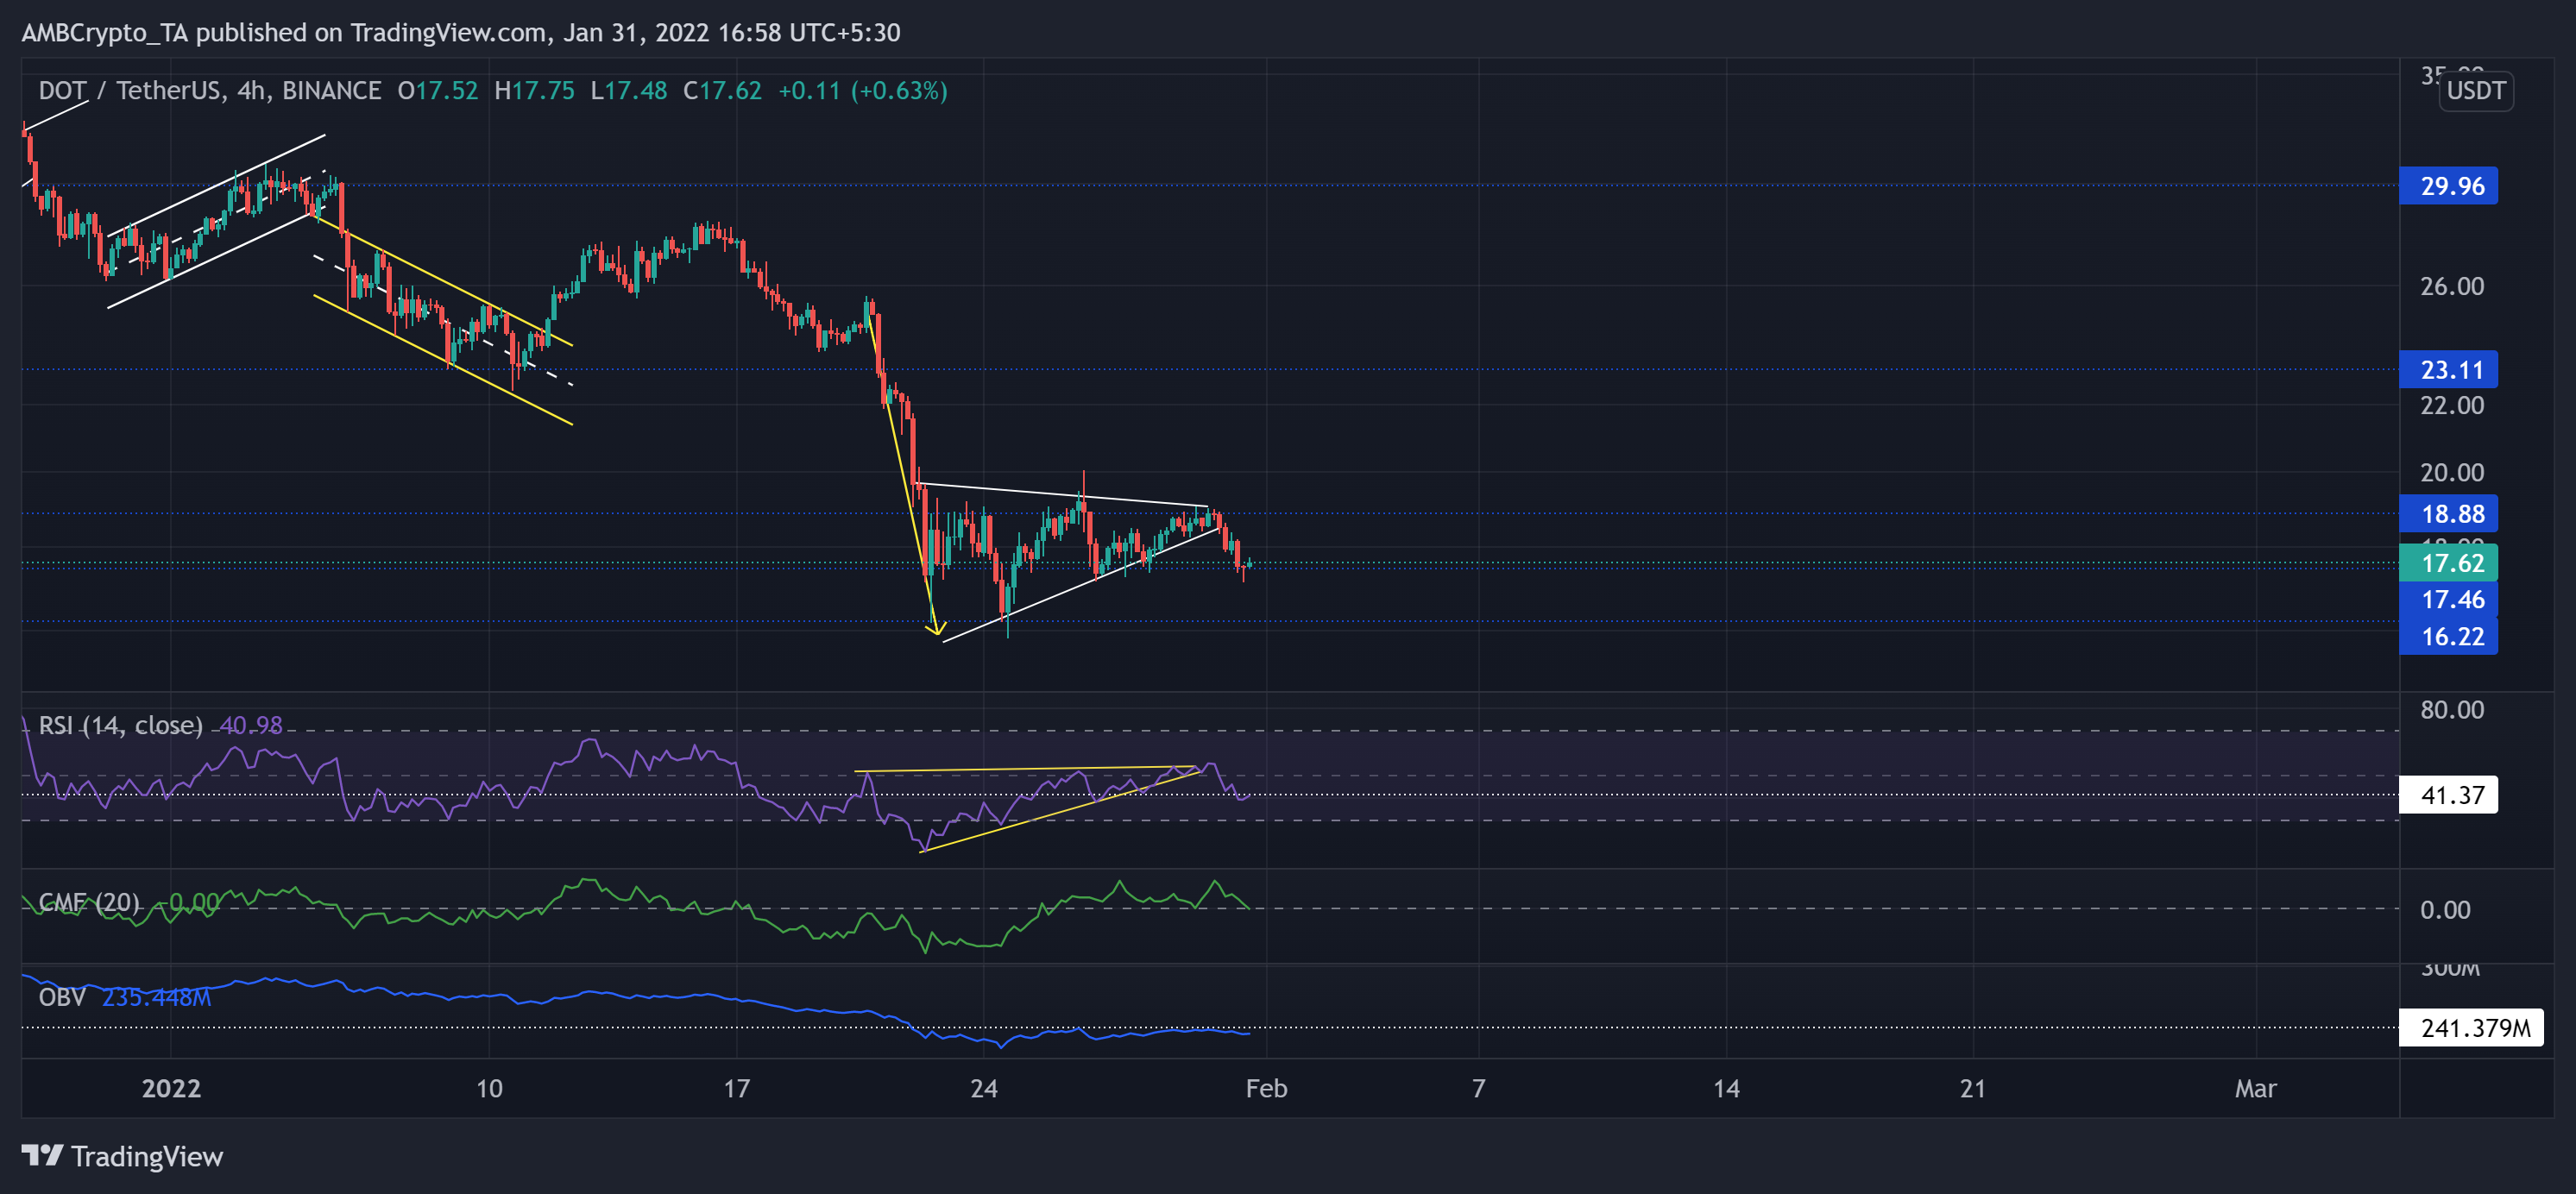
The bears were in the driving seat after they flipped the $23.11-mark five-month support to resistance. The altcoin gravitated toward its 25-week low on 24 January, post a 38.34% decline (from 20 January).
Over the past day, DOT saw a bearish pennant breakdown on its 4-hour chart while the bears exerted increased pressure. The bulls ensured the $17.76-support, whereas the bears upheld the $18.8-mark resistance.
At press time, the alt was trading at $17.62. The RSI stood at the 41-mark. After testing the oversold region, it saw a nearly 39 point revival but struggled to cross the midline. Now, it showed recovery signs from the 41-mark support. Although the CMF managed a recovery above the midline, bears kept testing the zero-line over the past day. Also, the OBV still could not subdue its immediate resistance.
GALA
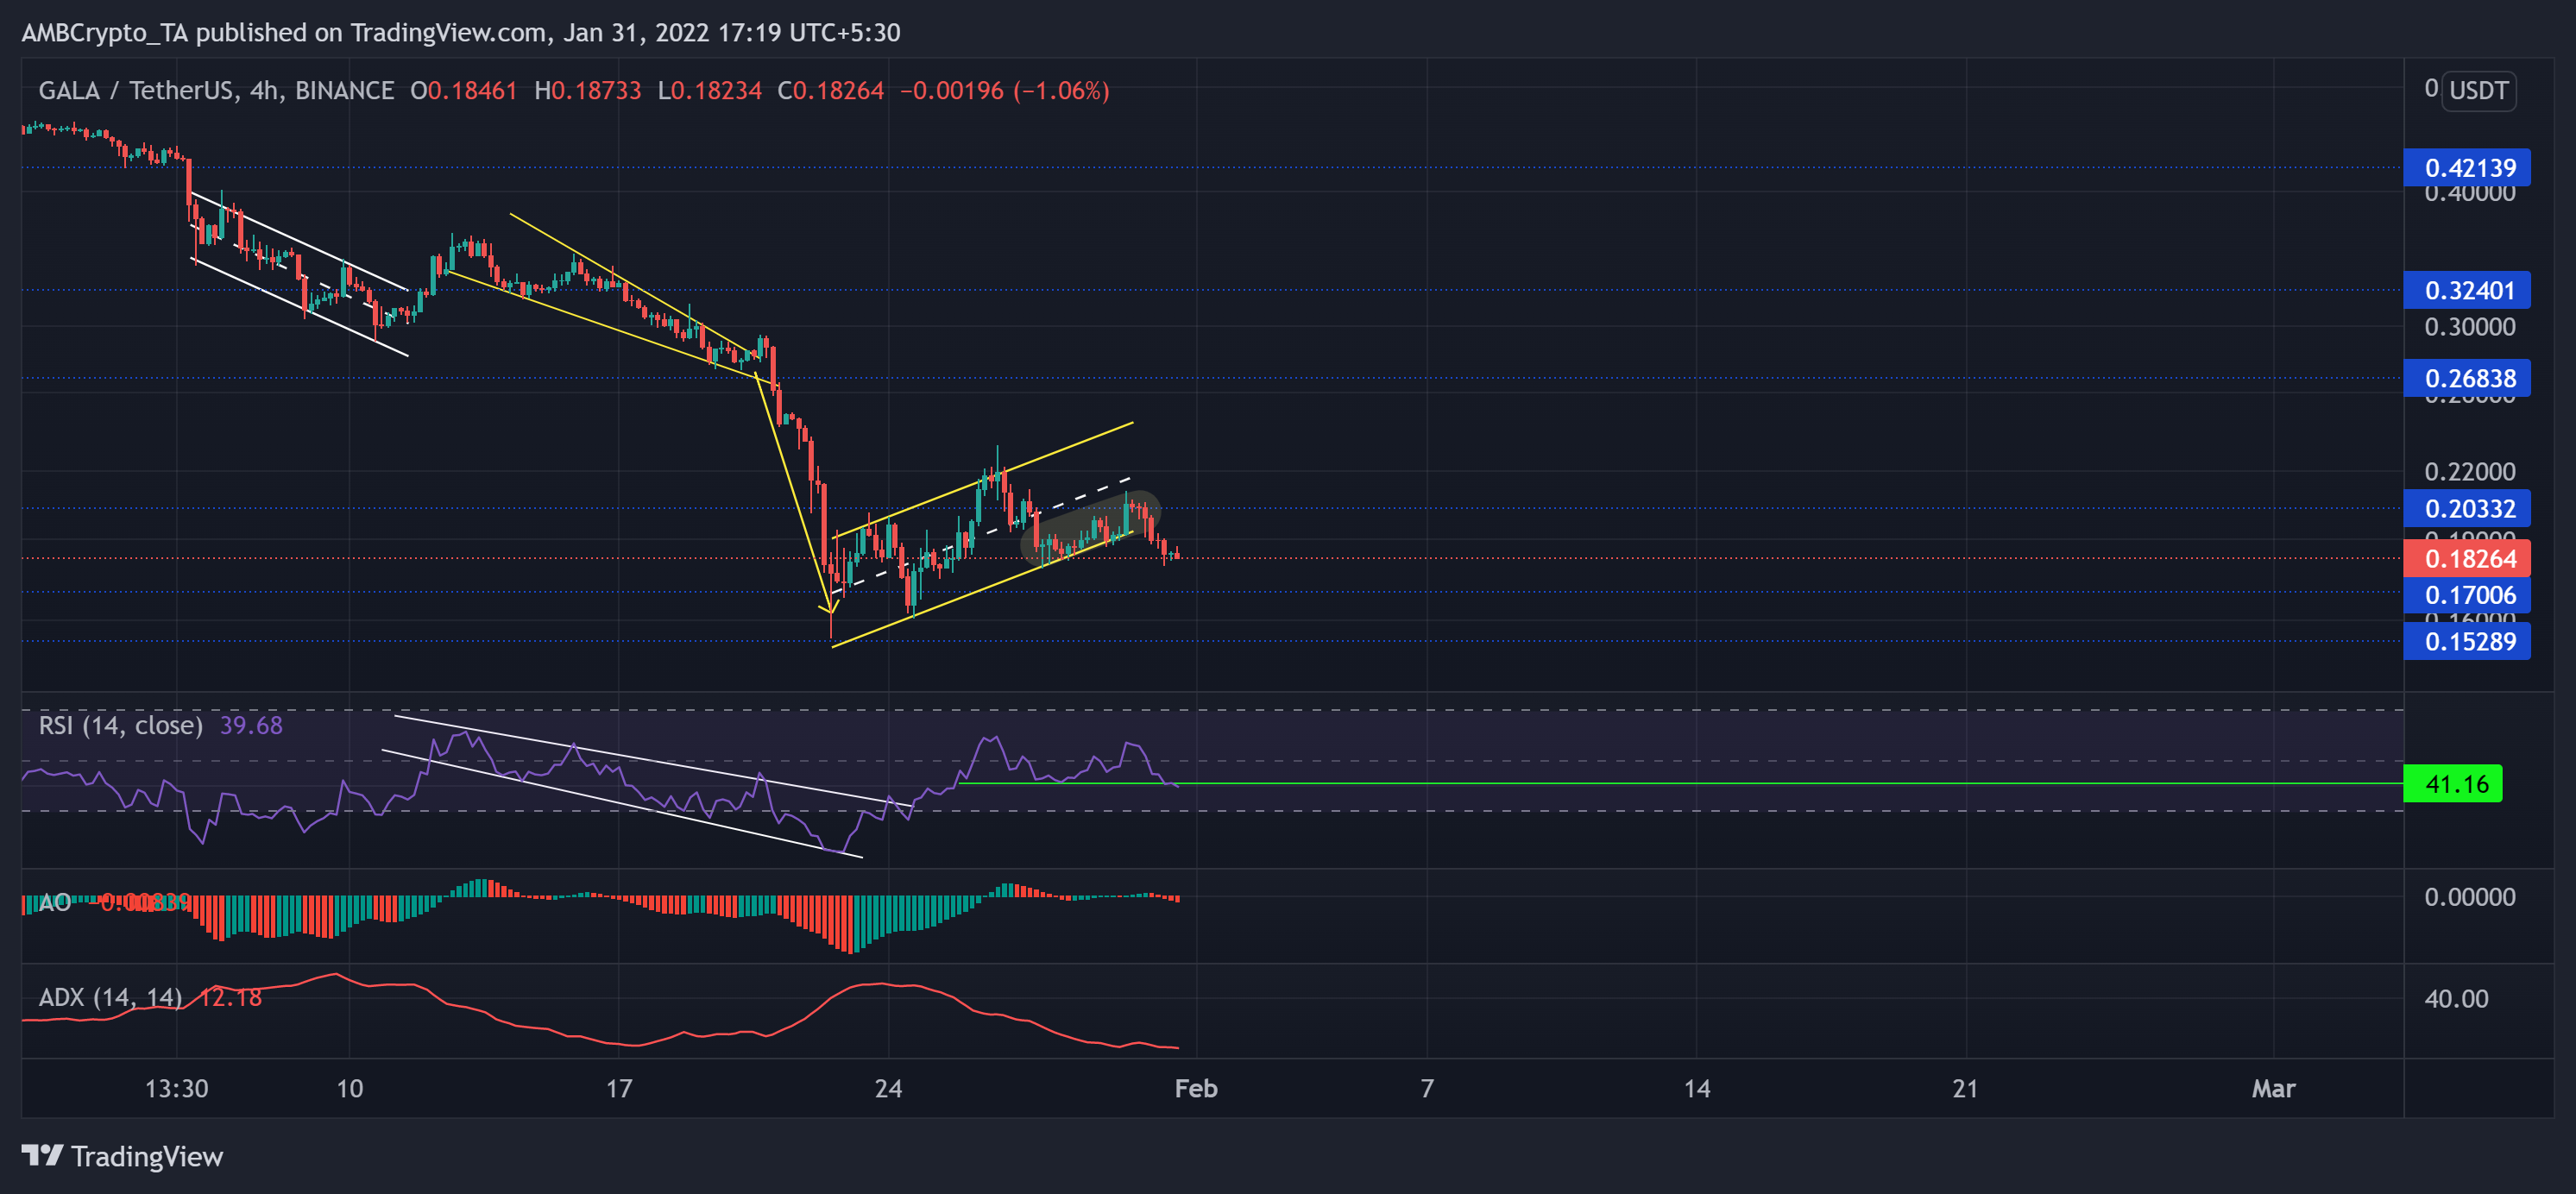
GALA lost its bullish vigor after it failed to uphold the $0.421-resistance. Then, it even lost the $0.32-level only to witness another sell-off on 21 January. GALA lost 58.16% of its value (from 12 January) until it touched its two-month low on 22 January.
The alt witnessed a classic bearish flag breakdown over the past day. The immediate testing point for the bears stood at the $0.17-level.
At press time, GALA was trading at $0.18264. The recent revival saw a strong RSI comeback, but it failed to sustain a close above the equilibrium. Over the past few days, it tested the 41-mark before breaching it and being southbound. Further, the AO fell below the midline, hinting at increased selling influence. Besides, the ADX displayed a weak directional trend for the alt.