
Bitcoin faces critical battleground: Spot hesitates amid Futures strength

- Cardano reflected a positive outlook on-chain, but the price action differed.
- The short-term downtrend has not halted despite the recent bounce.
Cardano [ADA] retested a support level at $0.58 on 20th March and bounced higher. This pushed ADA to retest the $0.63 resistance zone, which had served as support just a few days earlier.
AMBCrypto reported that Cardano’s development activity eclipsed that of Ethereum’s [ETH] in March. Recently, its active addresses also saw a large uptick, and transaction fees reached a two-year high.
The 4-hour order block was problematic
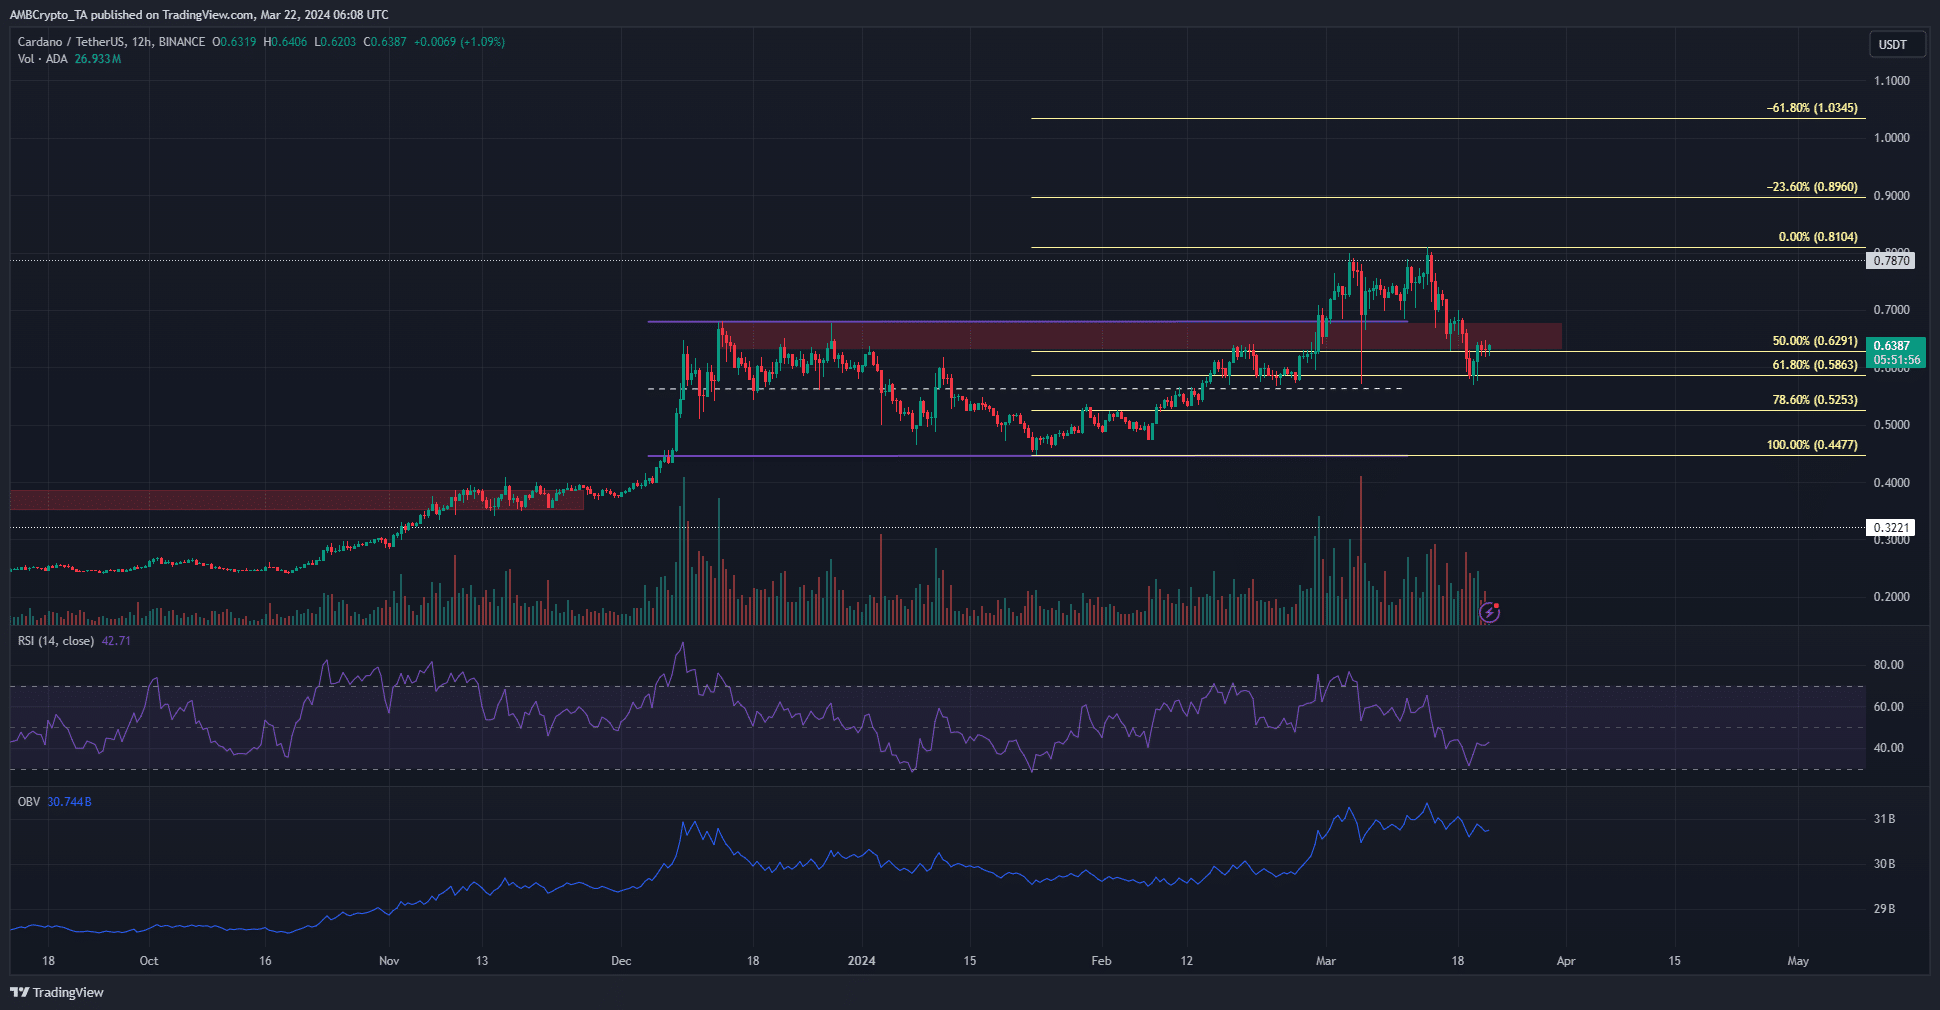
Source: ADA/USDT on TradingView
Earlier this month, ADA broke out of a 3-month range (purple) whose highs were at $0.68. The $0.63-$0.68 region was a resistance zone from the 4-hour chart’s price action back then. When retested as support a few days earlier, the bulls failed to defend it.
Hope is not lost for the bulls. This breakdown saw the 61.8% Fibonacci retracement level retested. The $0.586 and $0.525 levels were crucial support levels. A drop below $0.447 would indicate a downtrend was in play on the 12-hour and daily timeframe.
The OBV trended downward over the past ten days. The RSI has been below neutral 50 since the 15th of March when ADA dropped below $0.7. This signaled that further drops in price were likely.
Examining the closest pocket of liquidity
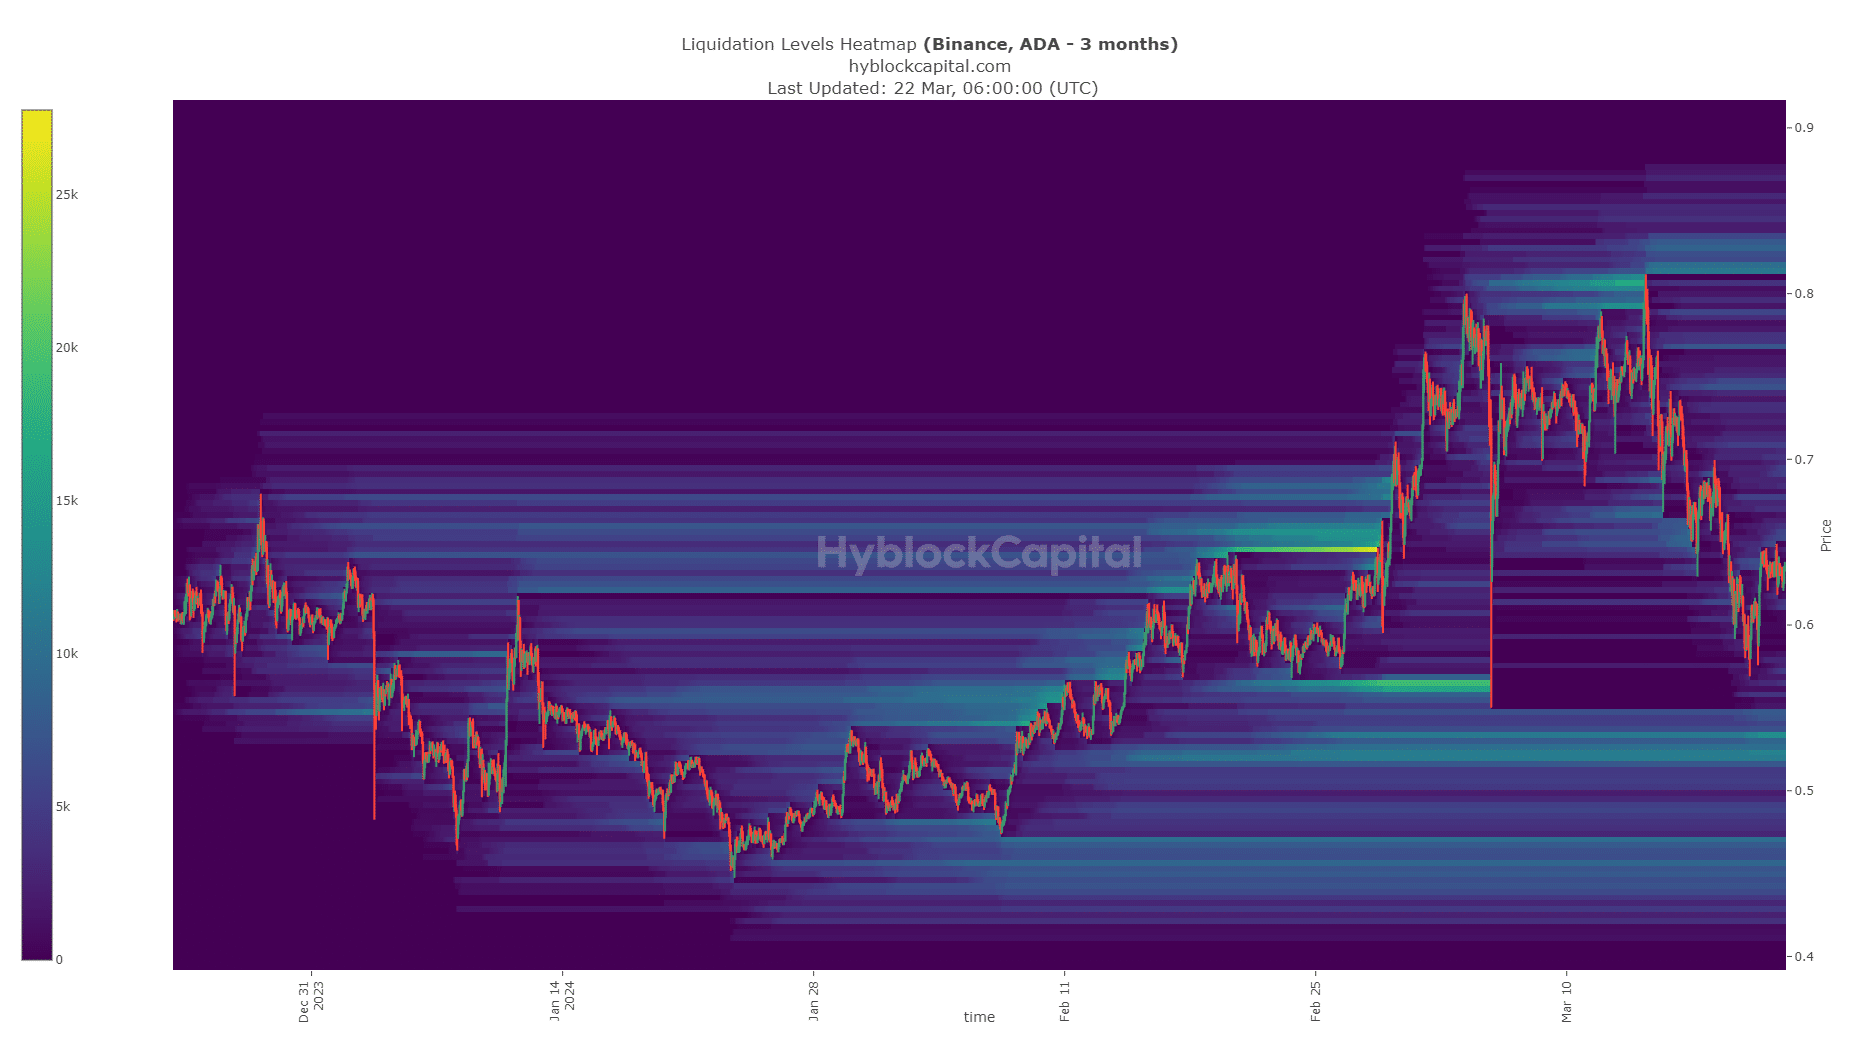
Source: Hyblock
AMBCrypto’s analysis of the liquidation levels heatmap data showed that there were two regions of interest. The $0.52-$0.54 area and the $0.81-$0.835 area could prove pivotal for ADA in the long run.
How much are 1, 10, or 100 ADA worth today?
The liquidity pocket near $0.5 was closer, and Bitcoin [BTC] has still not finished its lower timeframe pullback.
Therefore, a drop to $0.52 to collect this liquidity was expected. It would present an ideal long-term buying opportunity. On the other hand, if ADA climbs above $0.7, it could be headed to the $0.83 zone next.
Disclaimer: The information presented does not constitute financial, investment, trading, or other types of advice and is solely the writer’s opinion.


![Solana [SOL]](https://ambcrypto.com/wp-content/uploads/2025/08/Solana-SOL-1-400x240.webp)
