


Cardano’s price is witnessing a roller-coaster ride and is currently trading at $0.1506 with a market cap of $4.7 billion making it the 10th largest crypto in the world. With bitcoin treading slow, altcoins have a chance to surge, and the same opportunity can be seen with Cardano.
Cardano 4-hour chart

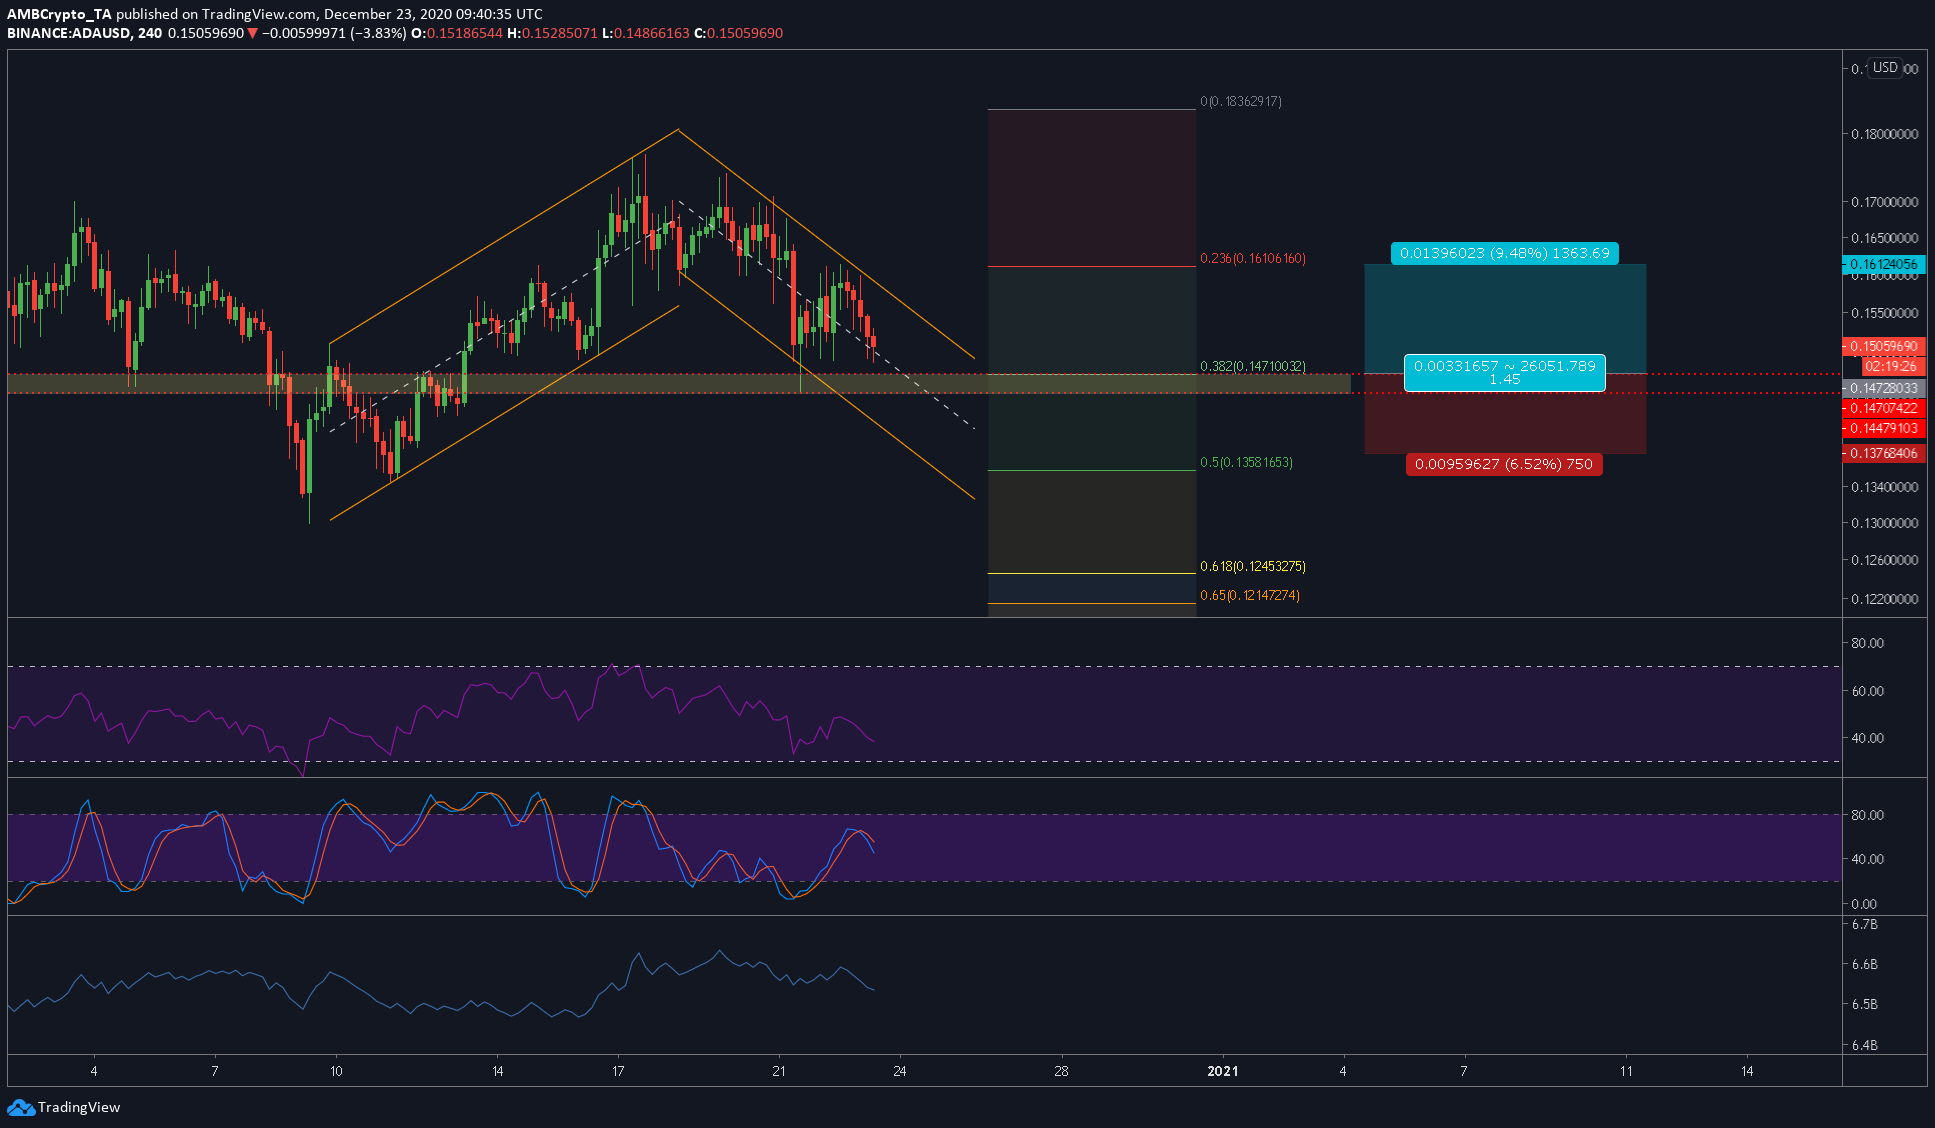
As seen, ADA is in a parallel channel pattern; in fact, the current descending channel pattern was preceded by another ascending channel pattern. At press time, the price is tussling with the centerline of the channel which acts as interim support. Breaching this will cause the price to head towards the bottom of the channel.
By the looks of it, there will be a small drop for ADA in the short-term followed by a surge.
Rationale
The RSI indicator has continued its descent towards the oversold zone, indicating sellers. This can also be witnessed in the price drop of 7% in the last 6 hours. The result of this can be witnessed in the Stochastic RSI which has developed a bearish crossover before hitting the overbought zone.
The OBV indicators also prove that sellers are present, however, they are declining in number or quantity.
Due to this reason alone, ADA will hit a support level and bounce from there to the top of the channel or out of the pattern. Hence, the overall position should be long and not short.
The liquidity pocket below the 0.382-Fibonacci level [$0.1471] will be the level that will cause this bounce. However, there is a risk of the price dipping below this pocket and hitting the 0.5-Fibonacci level at $0.1358.
Levels to lookout
A long position would yield a good yet conservative profit of 9.48%.
Entry: $0.14728033
Stop-Loss: $0.13768406
Take-Profit: $0.16124056
Risk-to-Reward:1.45
Perhaps reducing risk can be done by tightening the stop-loss at $0.1416 instead of the above and hence increasing our R/R to 2.47. This way, if the stop-loss is hit, the loss won’t be as much as before.