Analysis
Cardano price analysis: 9 December
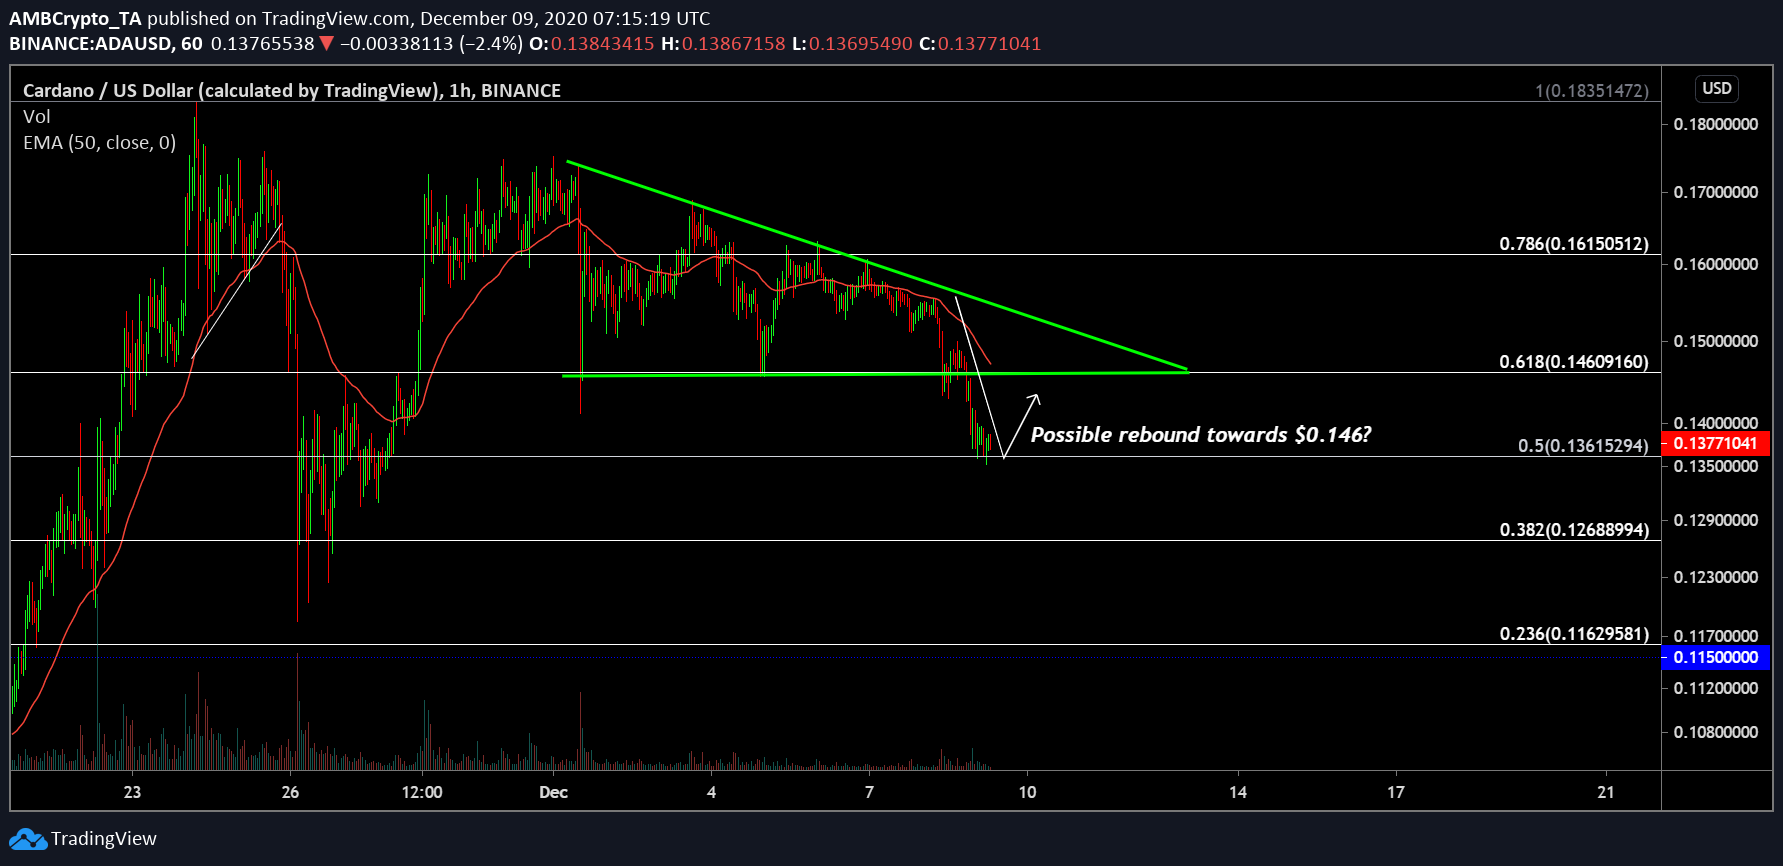
Majority of digital assets are currently facing a minor slump and Cardano is at the forefront of collective corrections. Dropping below support at $0.146 over the past day, ADA registered a decline of 11.61%. Further depletion was stopped at the next support at $0.136.
Cardano 1-hour chart
ADA/USD on Trading View
Illustrated in the 1-hour chart, Cardano’s recent drop came on the back of a descending triangle formation. This pattern carries bearish implications even as the asset dropped below its immediate support-turned-resistance at $0.146.
The main positive that can be taken from this drop is that the asset was able to consolidate above the next support at $0.136. With a current valuation of $0.137, ideally, ADA should be possibly testing $0.146 in the charts to recover some bullish momentum.
However, 50-Exponential Moving Average is acting as overhead resistance, which suggested the presence of bears at $0.140-$0.146.
Market Reasoning
ADA/USD on Trading View
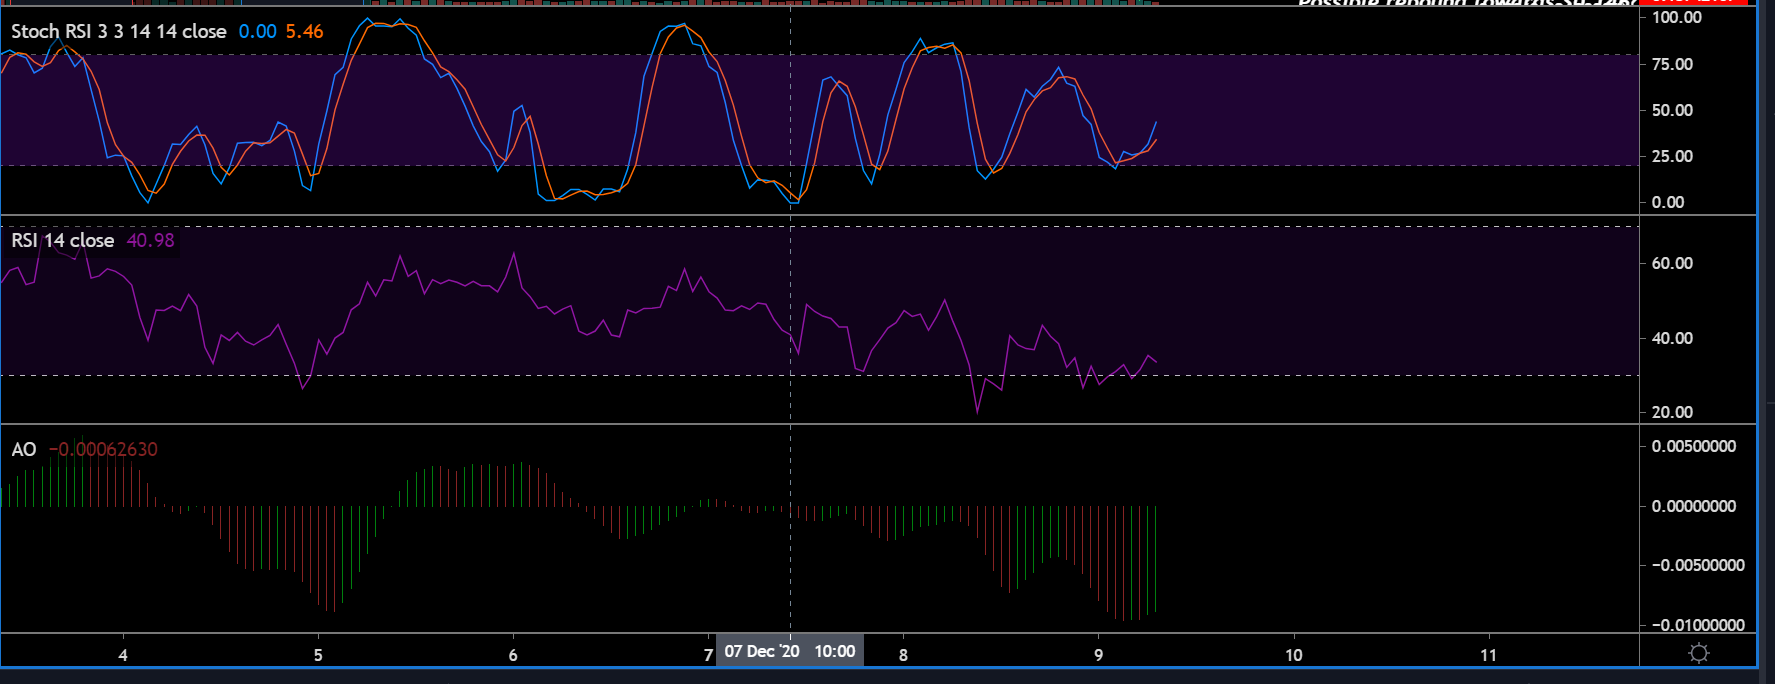
Market Indicators were suggestive of recovery as well. Stochastic RSI exhibited an uptick, which may drive the price up.
Relative Strength Index is still near the oversold region with the selling pressure maintaining dominance.
Awesome Oscillator is extremely bearish for the time being, but the emergence of a green candle at the present time is improving the current bearish scenario.
Important Range
Resistance: $0.161, $0.146
Support: $0.136, $0.126
It is difficult to predict a long-position based on the current charts.
Conclusion
While the price should move upward in the immediate trading session, Cardano might not be able to drive it back above $0.146 just yet. The collective market is relatively bearish at the moment.