Cardano price prediction: Why a July rally might not be in the cards
The range that ADA had maintained from December 2023 to May 2024 was broken and flipped to resistance in the first week of June.
- The market structure and technical indicators on the 1-day timeframe of Cardano were bearish.
- The liquidation heatmap highlighted key short-term levels to watch.
Cardano [ADA] continued its downtrend on the price chart. Cardano’s price prediction has been bearish on the higher timeframes since mid-April when the support level at $0.56 was lost. In the second half of June, bears showcased their intent once again.
The mid-April low at $0.4 failed to hold as support, and the price was hovering ominously around it. A push could send the prices tumbling. What is the next target for the sellers from here on?
Cardano price prediction shows bears will be happier in the coming days
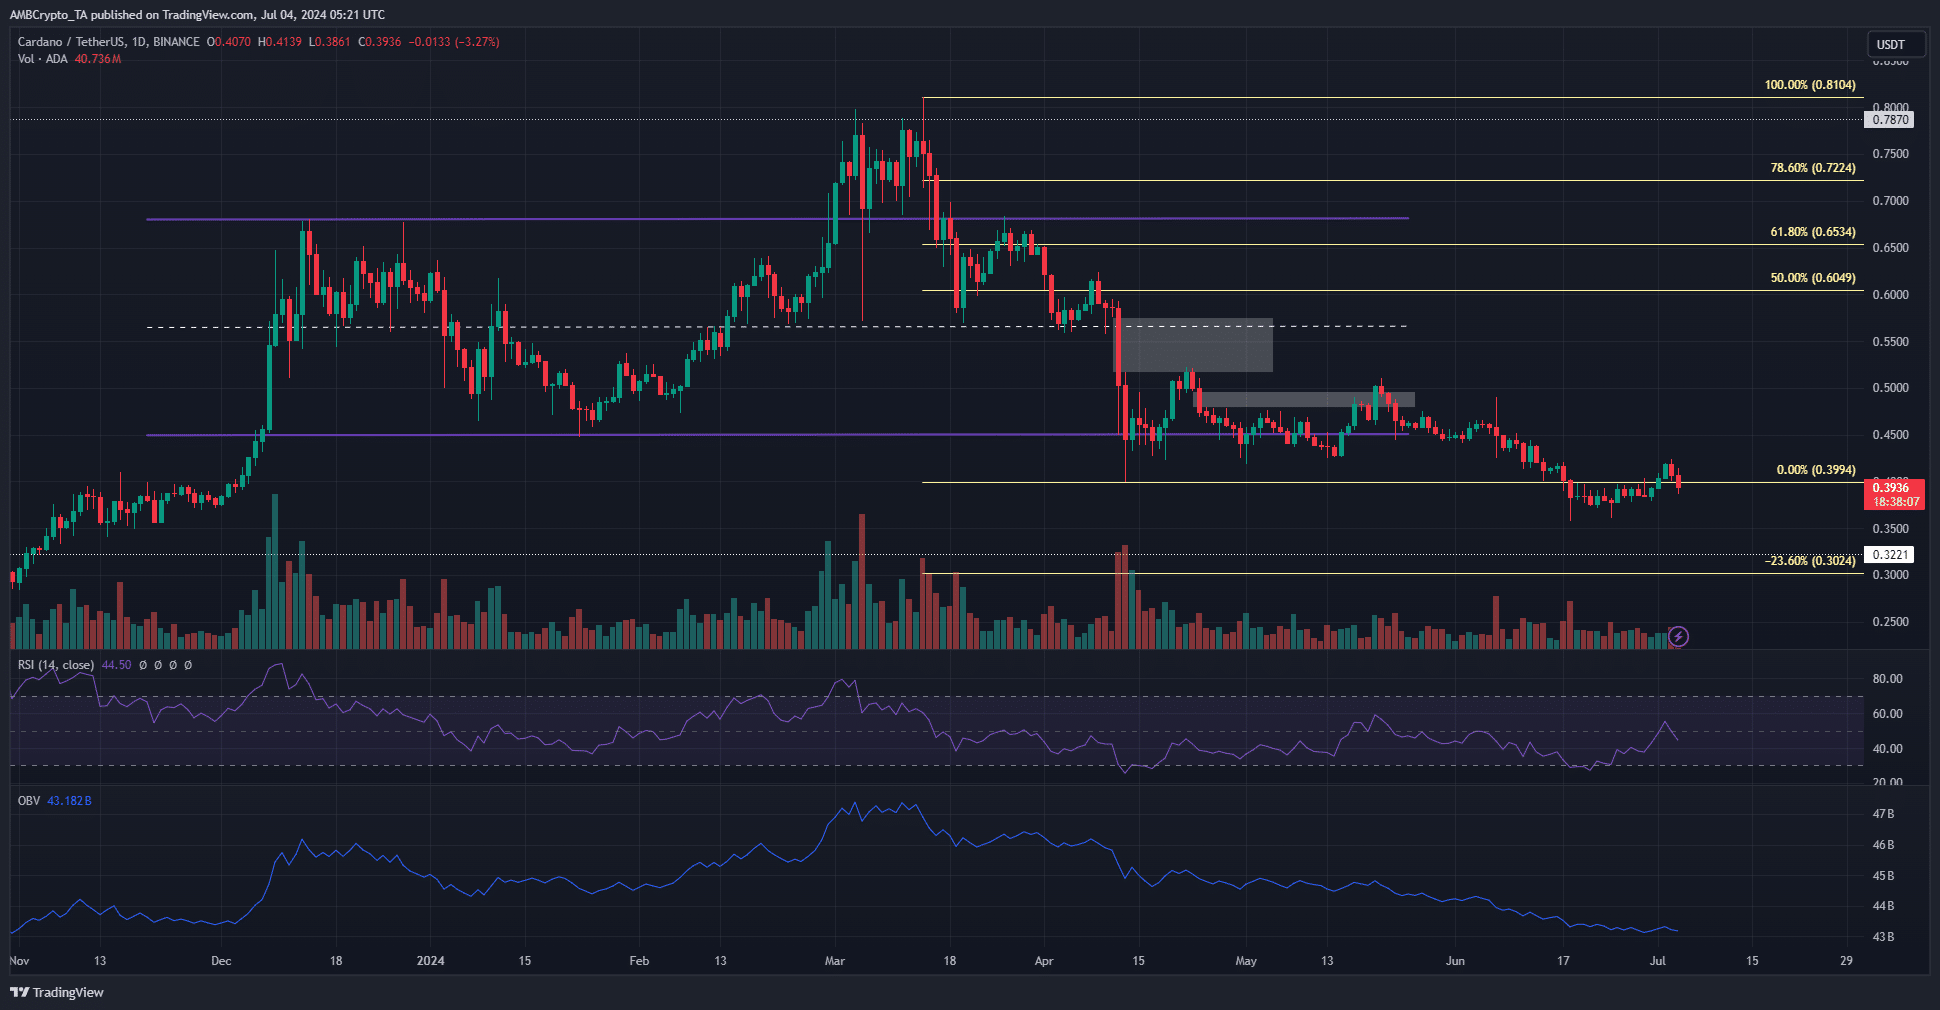
The range that ADA had maintained from December 2023 to May 2024 was broken and flipped to resistance. Based on the Fibonacci levels plotted during the March price decline, we can see that the next target for the bears is the 23.6% extension level at the $0.3 support level.
The daily timeframe technical indicators were also bearish. The RSI tried to poke its head above neutral 50 recently but faced rejection, cementing the bearish momentum.
The OBV was also in a persistent downtrend.
This signified strong selling pressure and the lack of buying volume, making it more likely that prices will fall toward $0.3 next.
The liquidation heatmap indicated a potential range formation
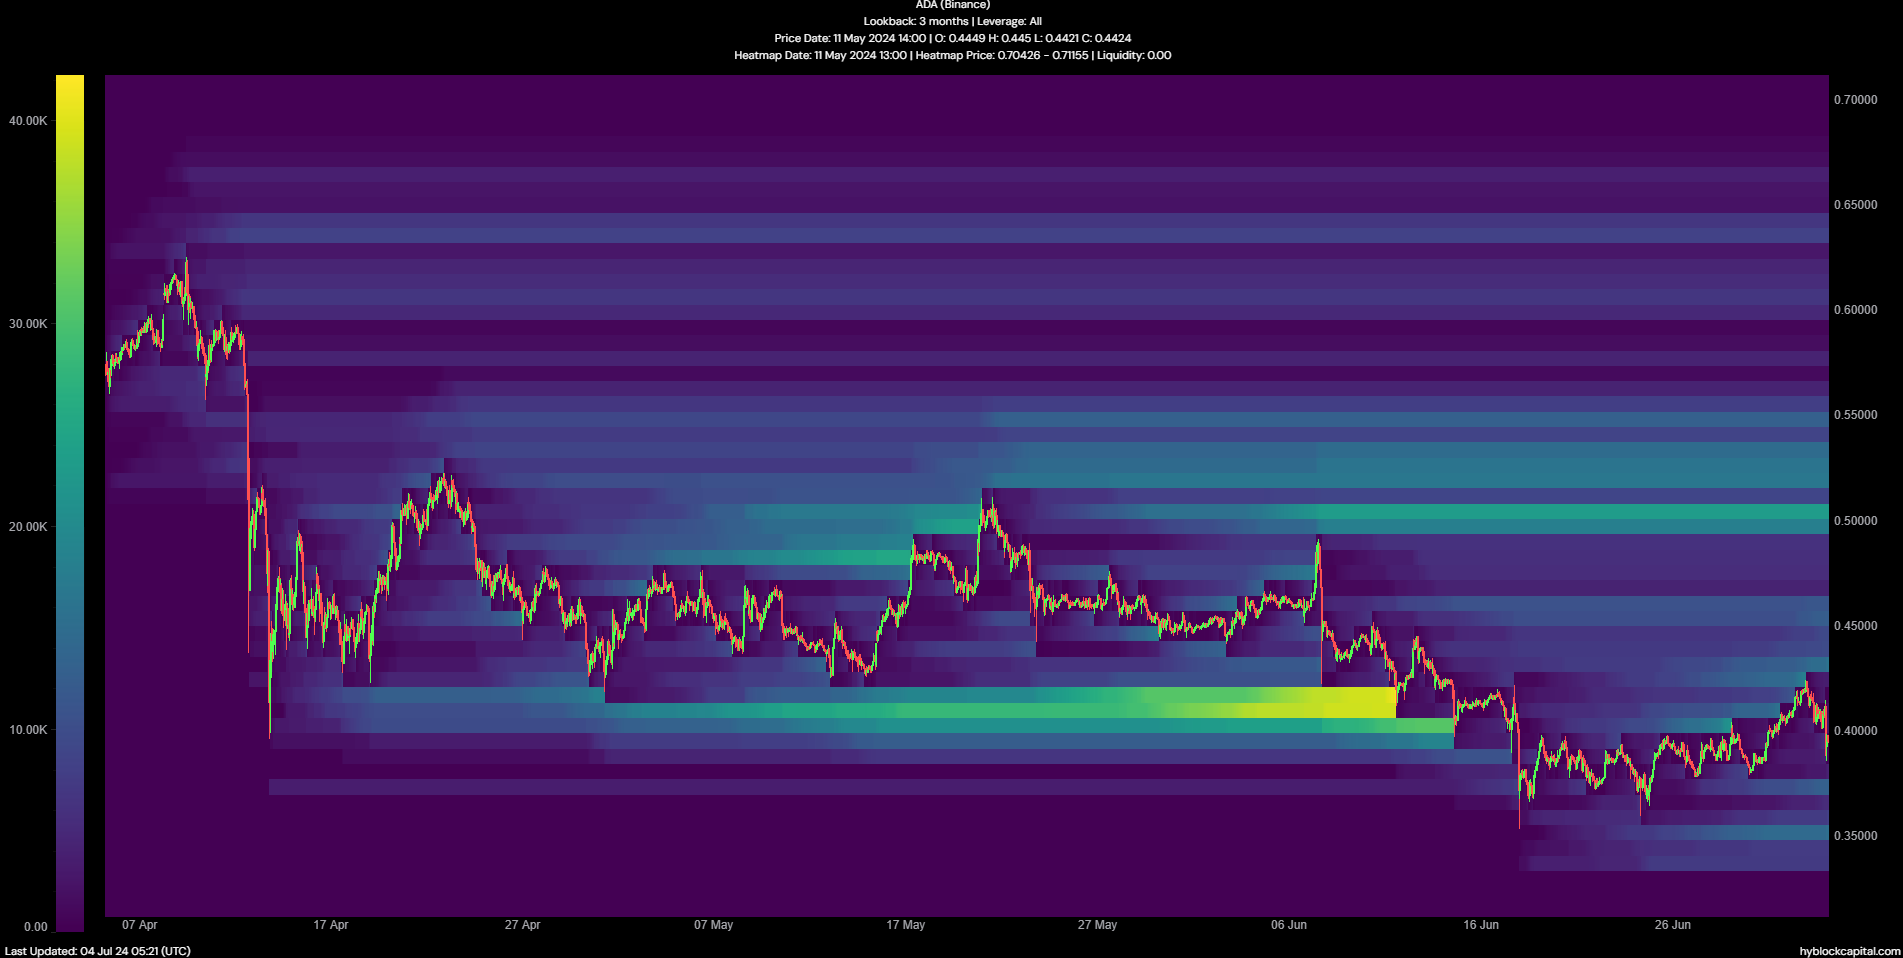
In early June, the $0.4-$0.415 region was a pocket of liquidity with a huge number of liquidation levels. It was tested as support and eventually ceded to the selling pressure. Over the past ten days it has been flipped to resistance.
Read Cardano’s [ADA] Price Prediction 2024-25
The liquidation heatmap showed some liquidity building up at $0.427, just above the recent high. The $0.35 was also a zone of interest in the short-term.
It is possible that ADA prices could oscillate between the $0.42-$0.37 levels to increase the liquidity above these two zones before collecting them in a few weeks.
Disclaimer: The information presented does not constitute financial, investment, trading, or other types of advice and is solely the writer’s opinion.