Cardano price prediction: Will ADA break above $0.46 soon?
ADA has been consolidating for weeks; data reveals it will not get out soon.

- ADA remains in consolidation, with indicators suggesting a bearish short-term outlook.
- Persistent negative indicators and low engagement hint at continued consolidation without a clear breakout.
Over the past few weeks, Cardano [ADA] has been trading between $0.40 and $0.46, showing limited movement as it consolidates. It was worth $0.44 at press time, with a decrease of 0.7% in the past twenty-four hours. Is ADA ready to exit its consolidation phase?
First, let’s examine the state of ADA’s derivatives market. Coinglass data showed mixed sentiment and massive reductions in trading activity.
The derivatives data shows varying degrees of bullish and bearish sentiment across different trading platforms. Binance is bullish, but OKX is leaning toward a bearish stance.
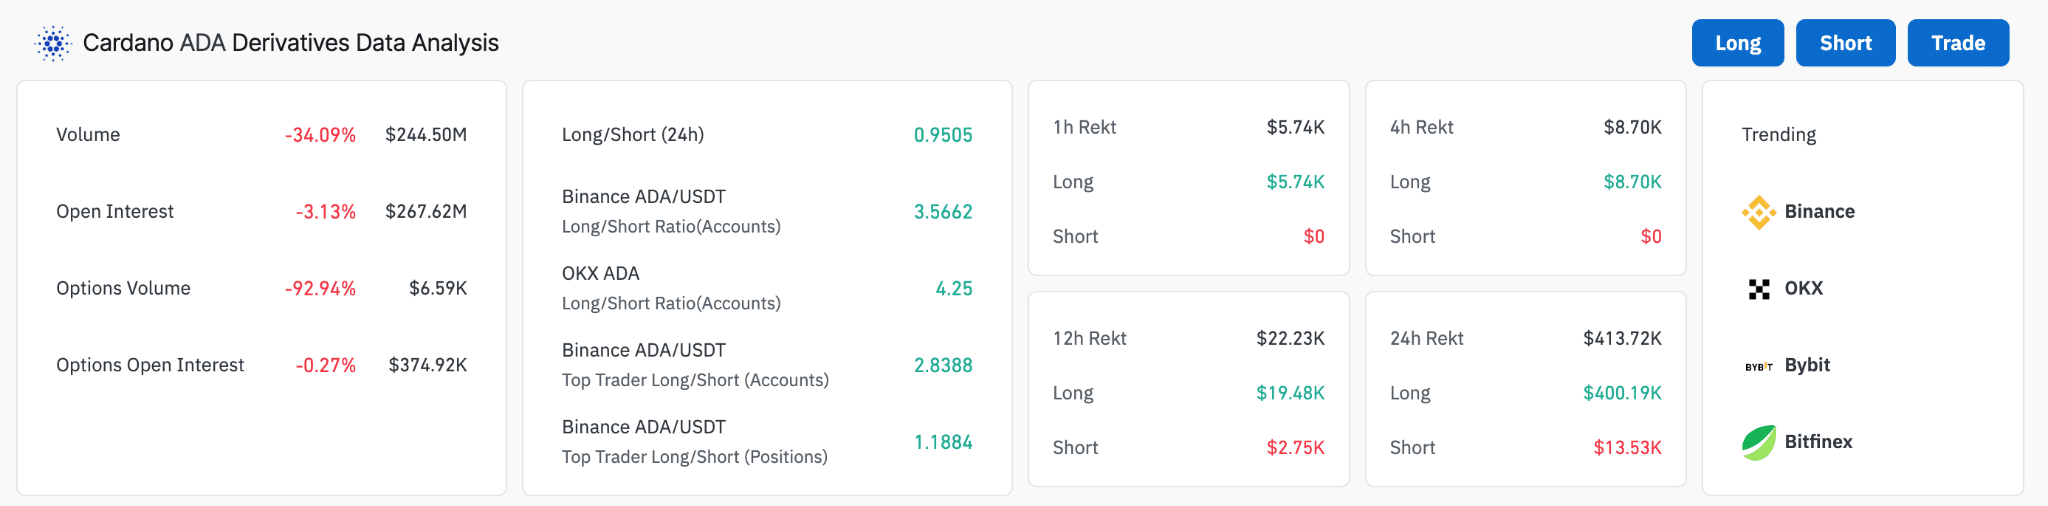
While some bullish sentiment is evident in long/short ratios, the drop in volume and options activity might cap any potential surge. Unless volume and trader engagement increase by a long margin, ADA may continue to trade within its current range without a clear breakout.
Currently trading at $0.447, ADA shows a slight downtrend as the MA50 (red line) dips below the MA200 (blue line), suggesting a bearish short-term outlook as it nears the lower boundary of its recent trading range.
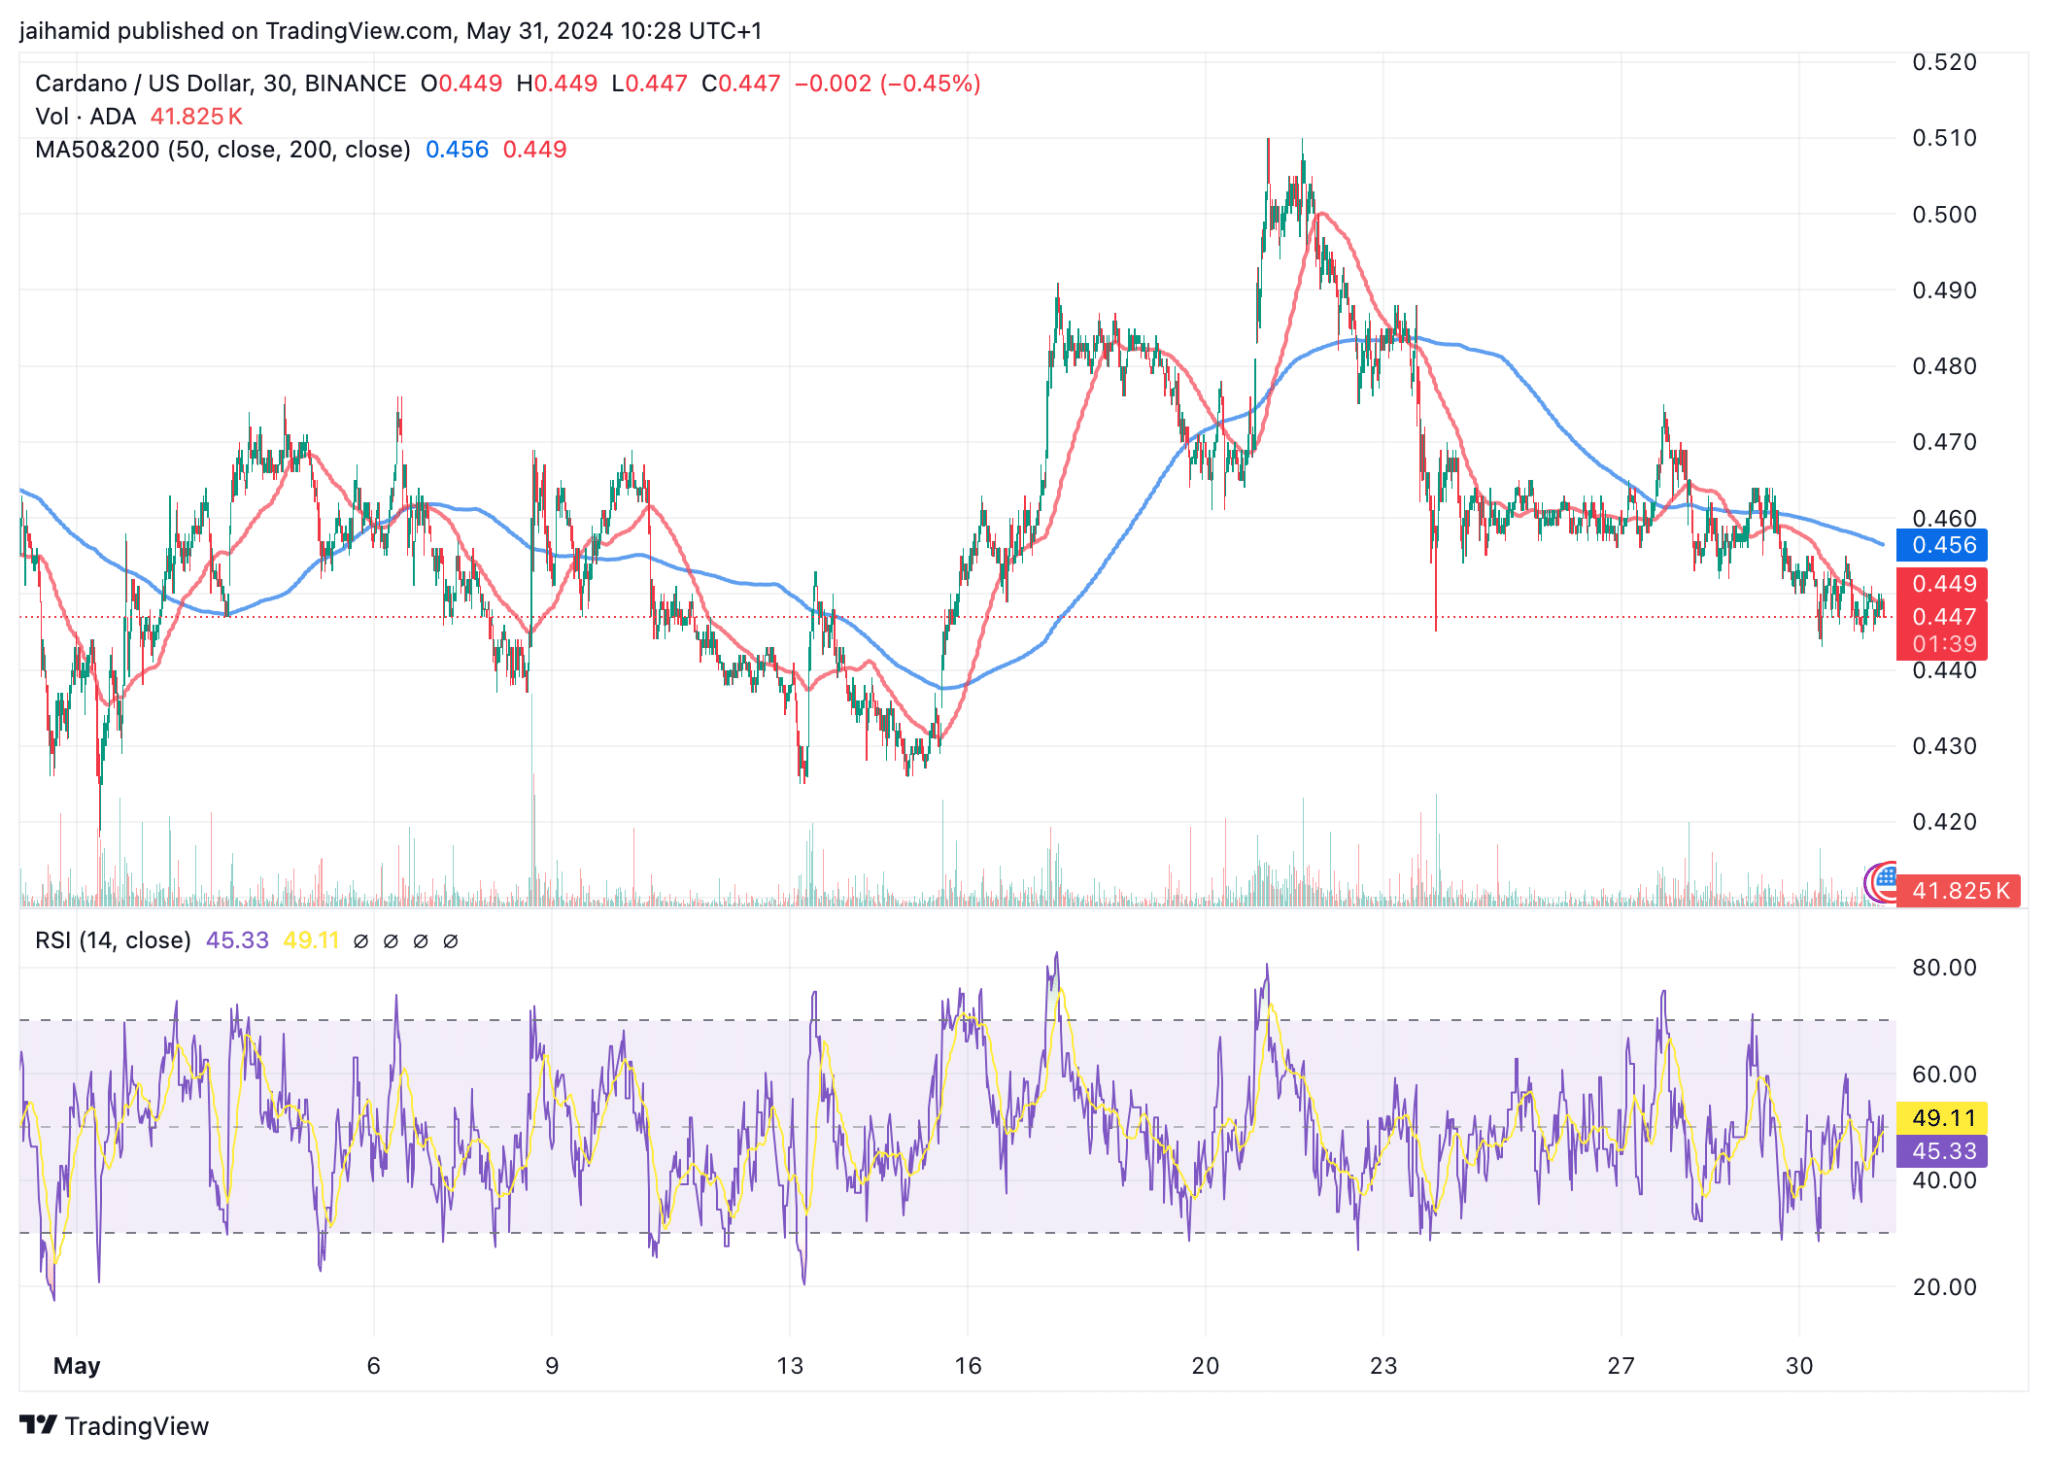
The Relative Strength Index (RSI), at 45.33, further supports a neutral to slightly bearish sentiment. It is neither in the oversold nor overbought zone, indicating that there is neither significant selling nor buying pressure driving the price out of its current consolidation zone.
To make matters worse, Cardano’s Fear and Greed Index right now sits at a comfortable score of ‘Fear.’ This is corroborated by predominantly negative ratings across several indicators.
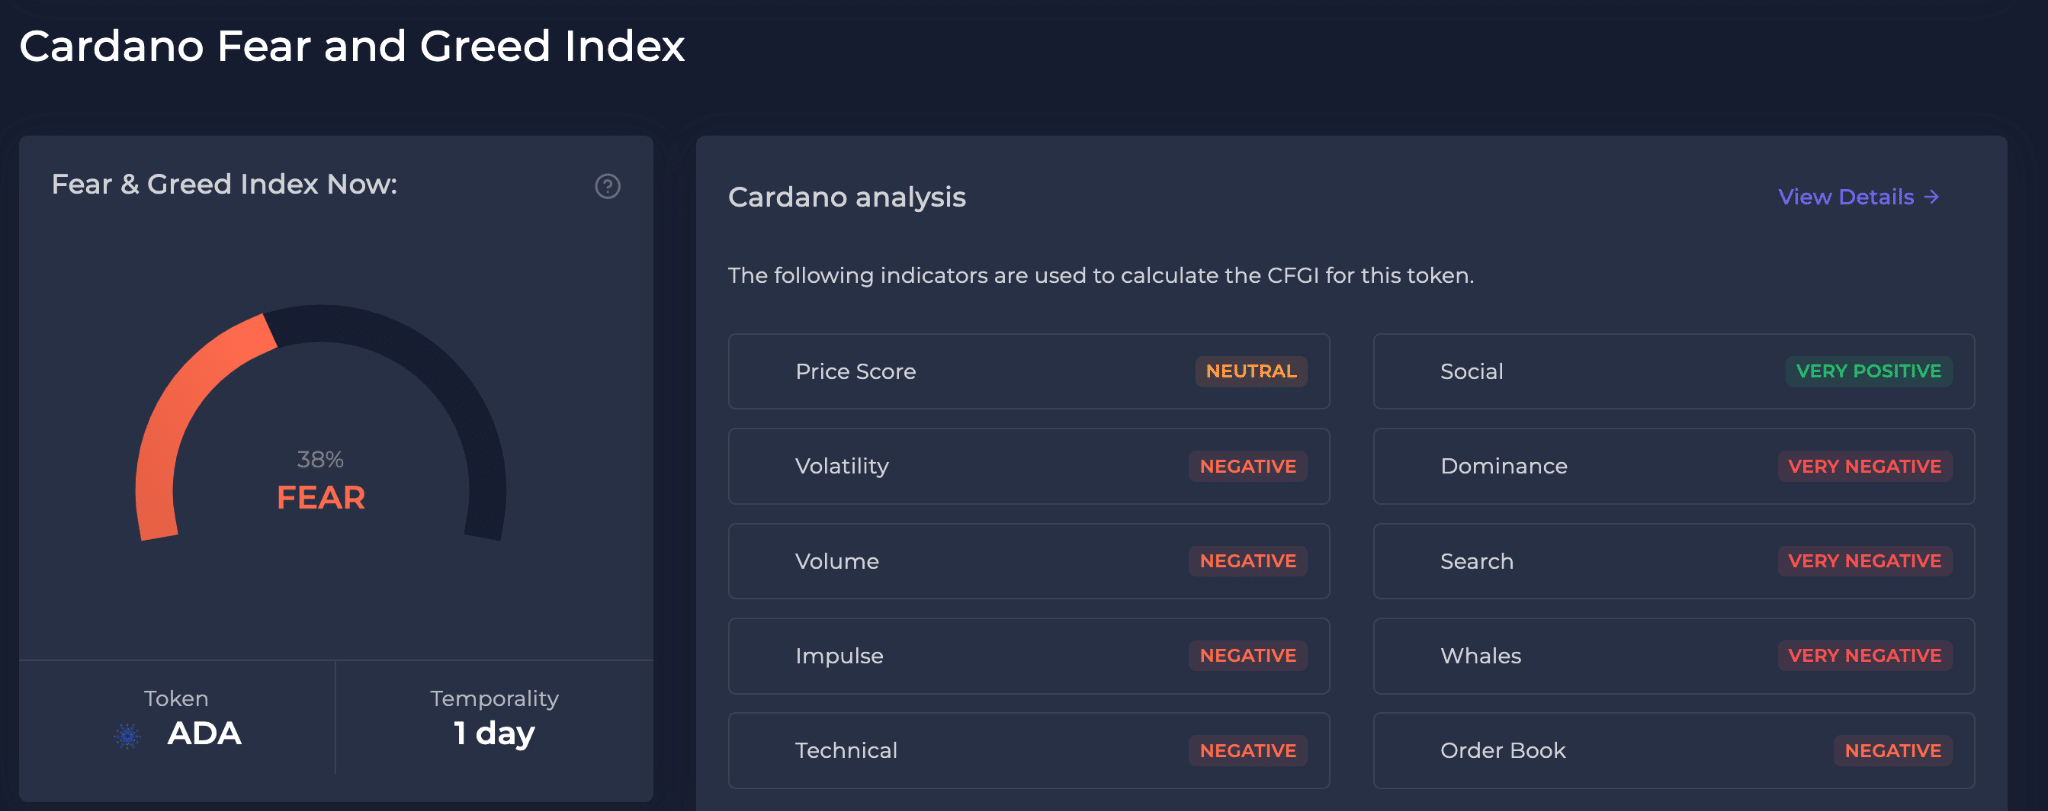
Volatility, volume, whales’ activities, and order book depth are all flagged as negative, which suggests reduced market activity and possible sell pressure. Over the past day, ADA’s social volume has fluctuated a lot, indicating varying levels of community interest and discussion.
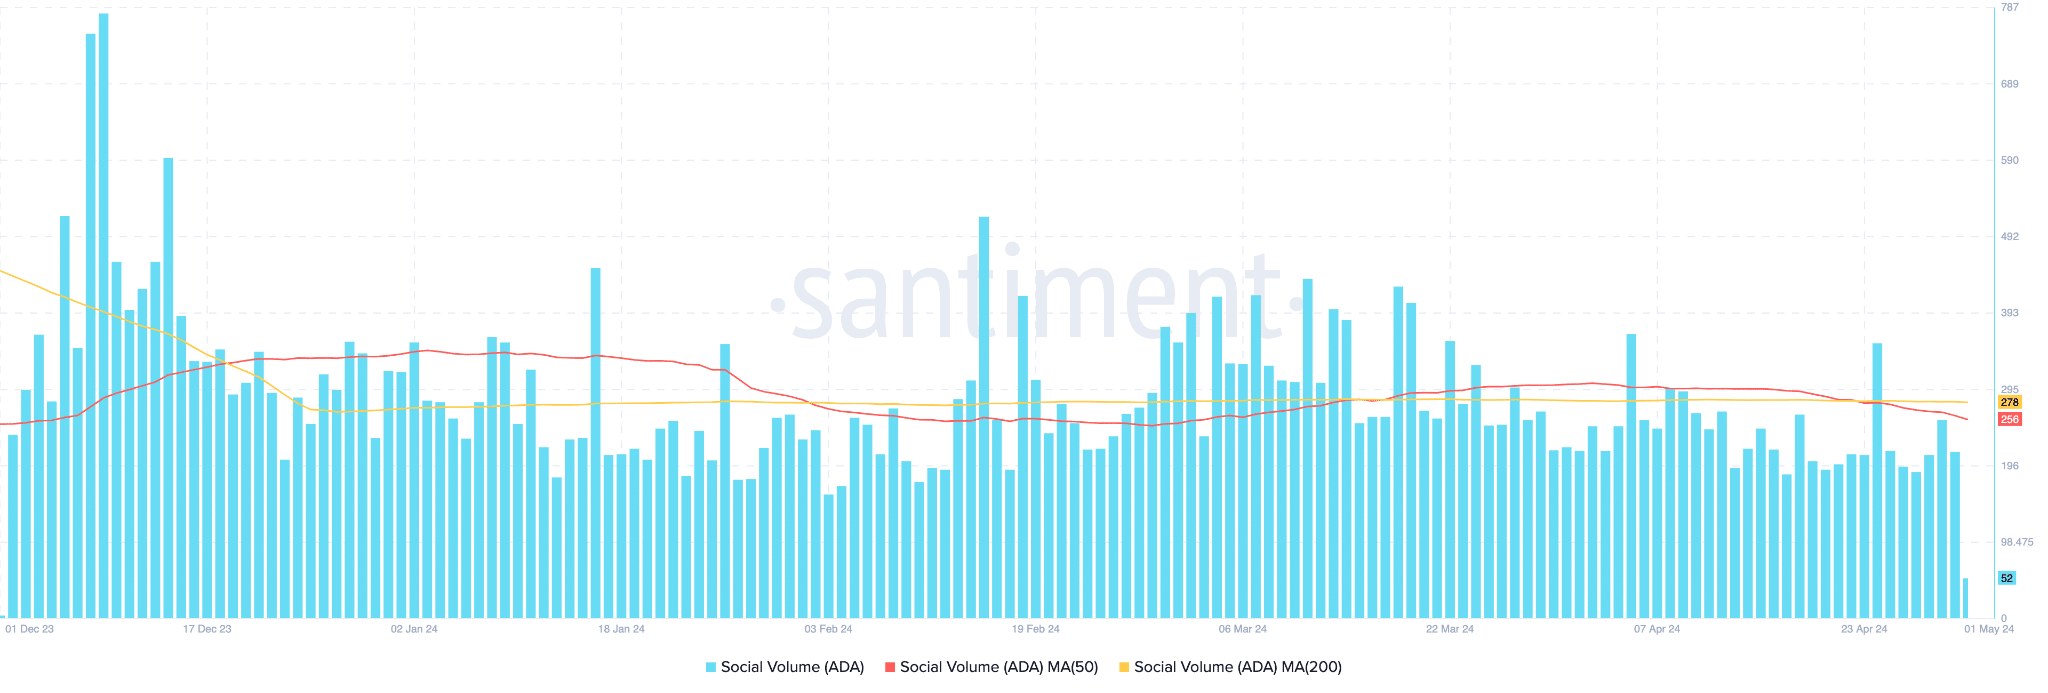
The 50-day moving average (red line) shows a gradual decline in social activity, suggesting that while there may be an intermittent rise in discussion, the general trend points to decreasing engagement.
This decline is more pronounced with the 200-day moving average (yellow line), highlighting a more sustained decrease in social mentions. All in all, ADA doesn’t seem to be getting out of consolidation anytime soon.


