Cardano, Shiba Inu, Solana Price Analysis: 30 October

The top 10 cryptos were in the green on 30 October and showed positive signs over the past day. Cardano, however, was up for some negative price action, at press time.
Shiba Inu and Solana continued to display positive signs over the past week. However, near-term technicals for both the cryptos seemed to show a slight preference for selling strength.
Cardano (ADA)
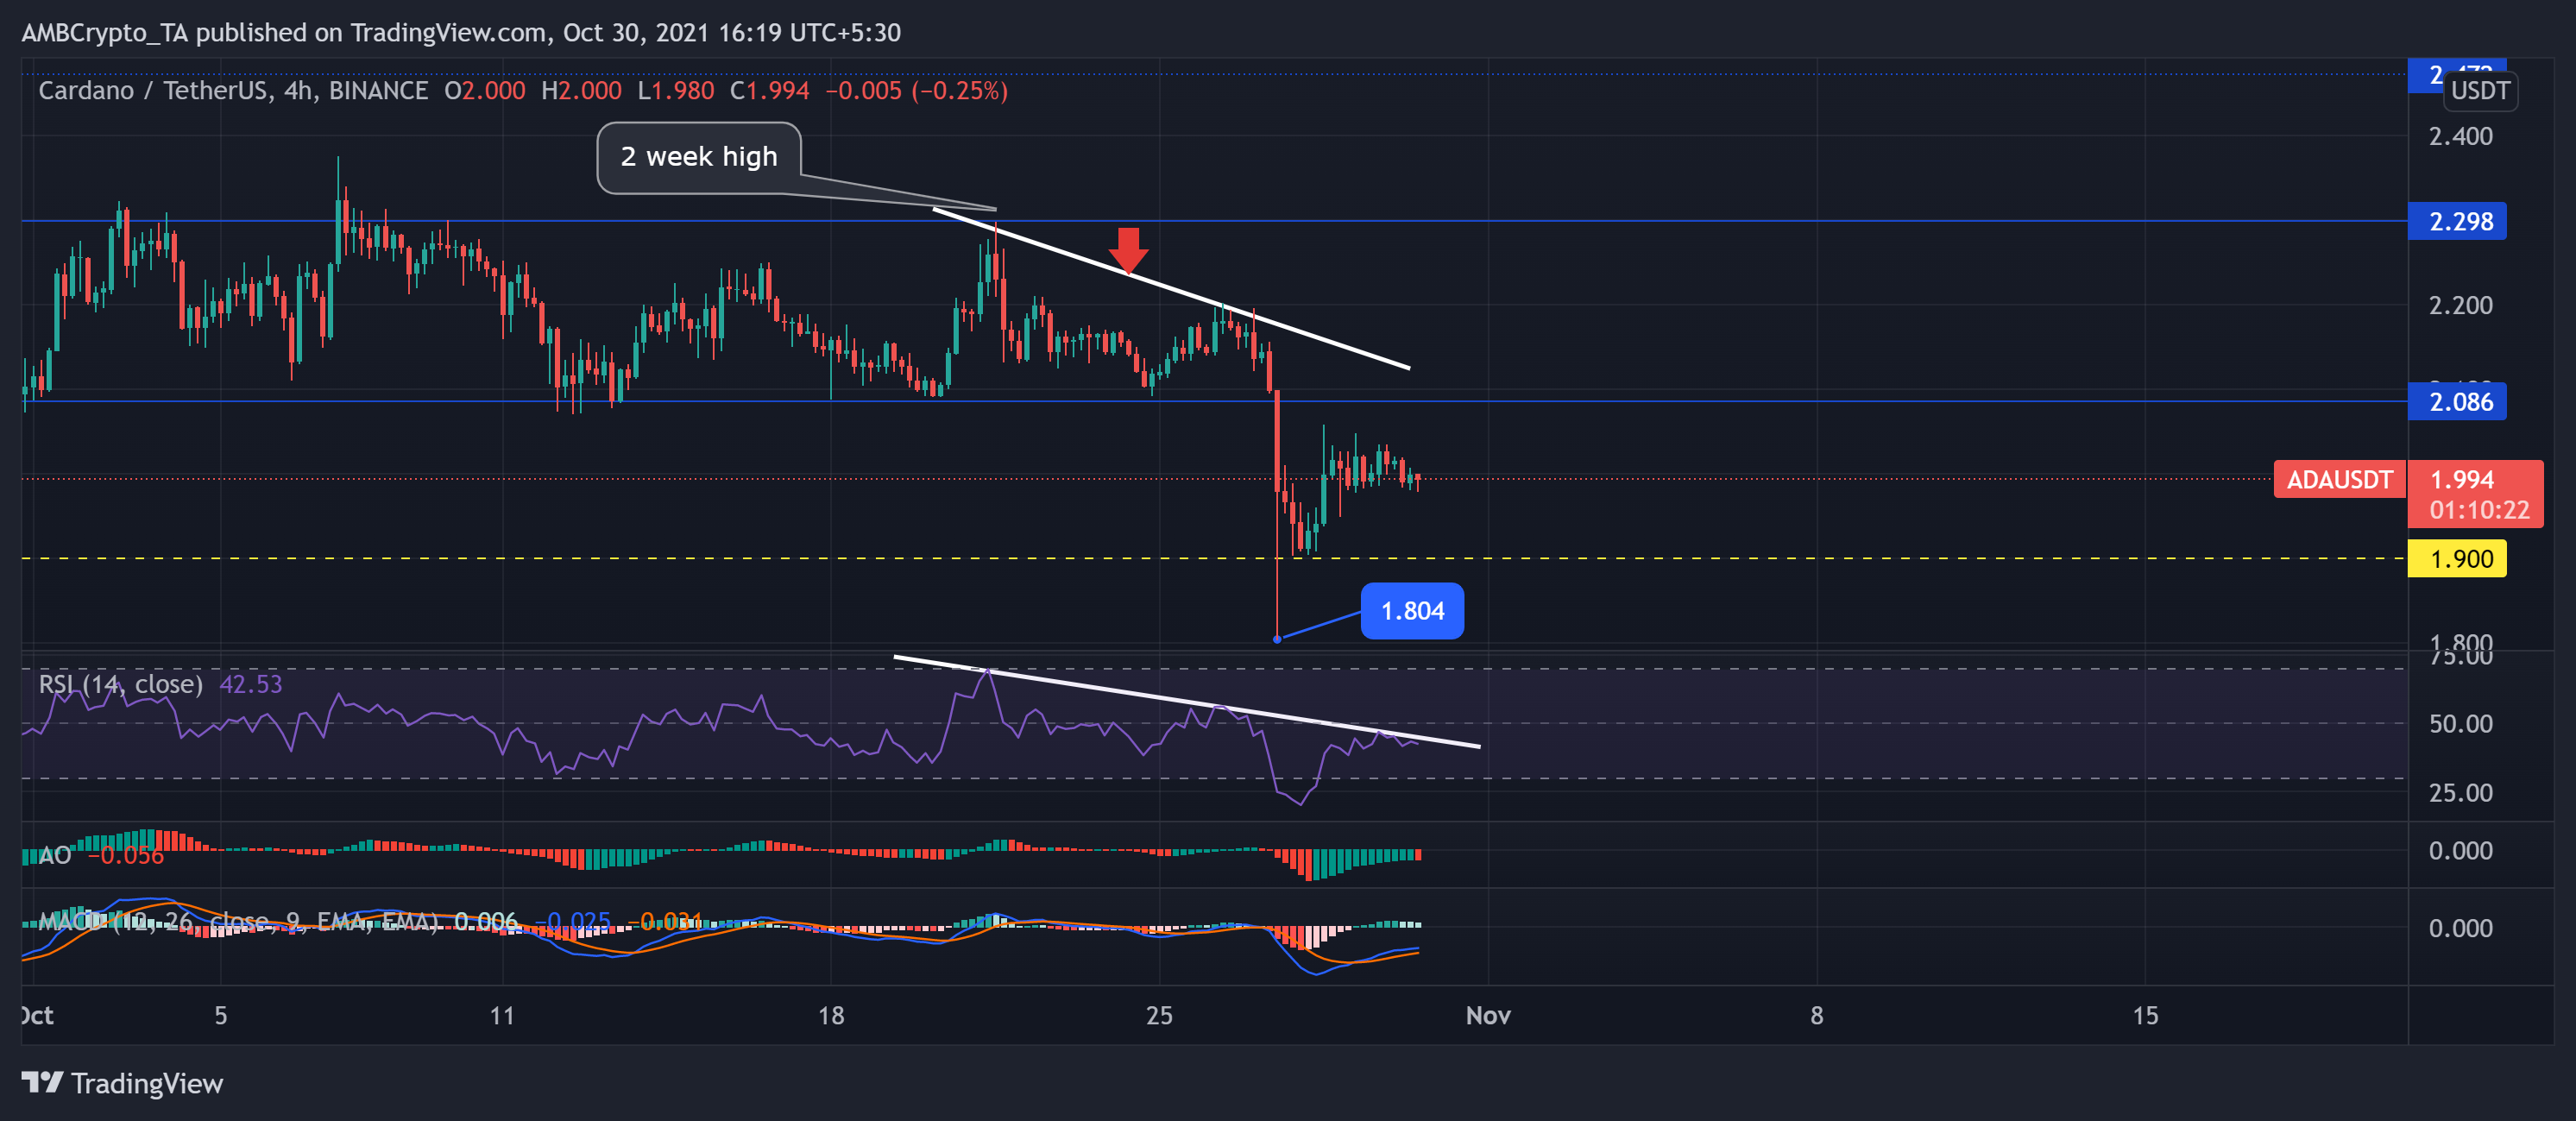
Since 30 September, ADA traversed laterally and bounced between $2.086 and $2.298. Consolidation occurred until the altcoin hit its two-week high on 21 October and headed towards the south. As the bears exerted immense pressure, they breached its immediate resistance of $2.086 and found support at $1.900. The fifth-largest crypto touched its eleven-week low at $1.804 on 27 October. Since then, ADA bulls have shown some vigor but are unable to sustain their pressure.
At press time, ADA traded at $1.994 and registered an 8.05% loss over the past week. Also, the near-term technicals indicated a slight decrease in buying power.
Furthermore, the Relative Strength Index (RSI) stood below the midline and displayed a bearish trendline that resonated with the increased selling power.
Additionally, the MACD histogram flashed shorter light green bars while the Awesome Oscillator displayed a red signal, indicating a slight decrease in buying strength.
Shiba Inu (SHIB)

The meme token undertook a bullish price action from 23 October after it got listed on multiple exchanges and progressed into the DeFI and NFT ecosystem. Consequently, it reached its ATH on 28 October and witnessed a slight pullback.
Over the last week, the price oscillated in an uptrend and bounced between the trendlines as the crypto noted a 116.02% and 8.12% weekly and daily ROI, respectively. If the SHIB bulls continue to exert pressure, a double top could occur at $0.00008870. However, near-term technicals suggested decreasing buying pressure.
The altcoin traded at $0.0000732 while the SHIB army found support at $0.0000618.
The RSI preferred the buyers but displayed a decreasing trend in favor of sellers. Additionally, the MACD and the AO flashed red signals reiterating decreasing buying power. However, the lower trendline marked higher lows, whereas the RSI trendline marked lower lows, indicating a possibility of bullish momentum.
Solana (SOL)
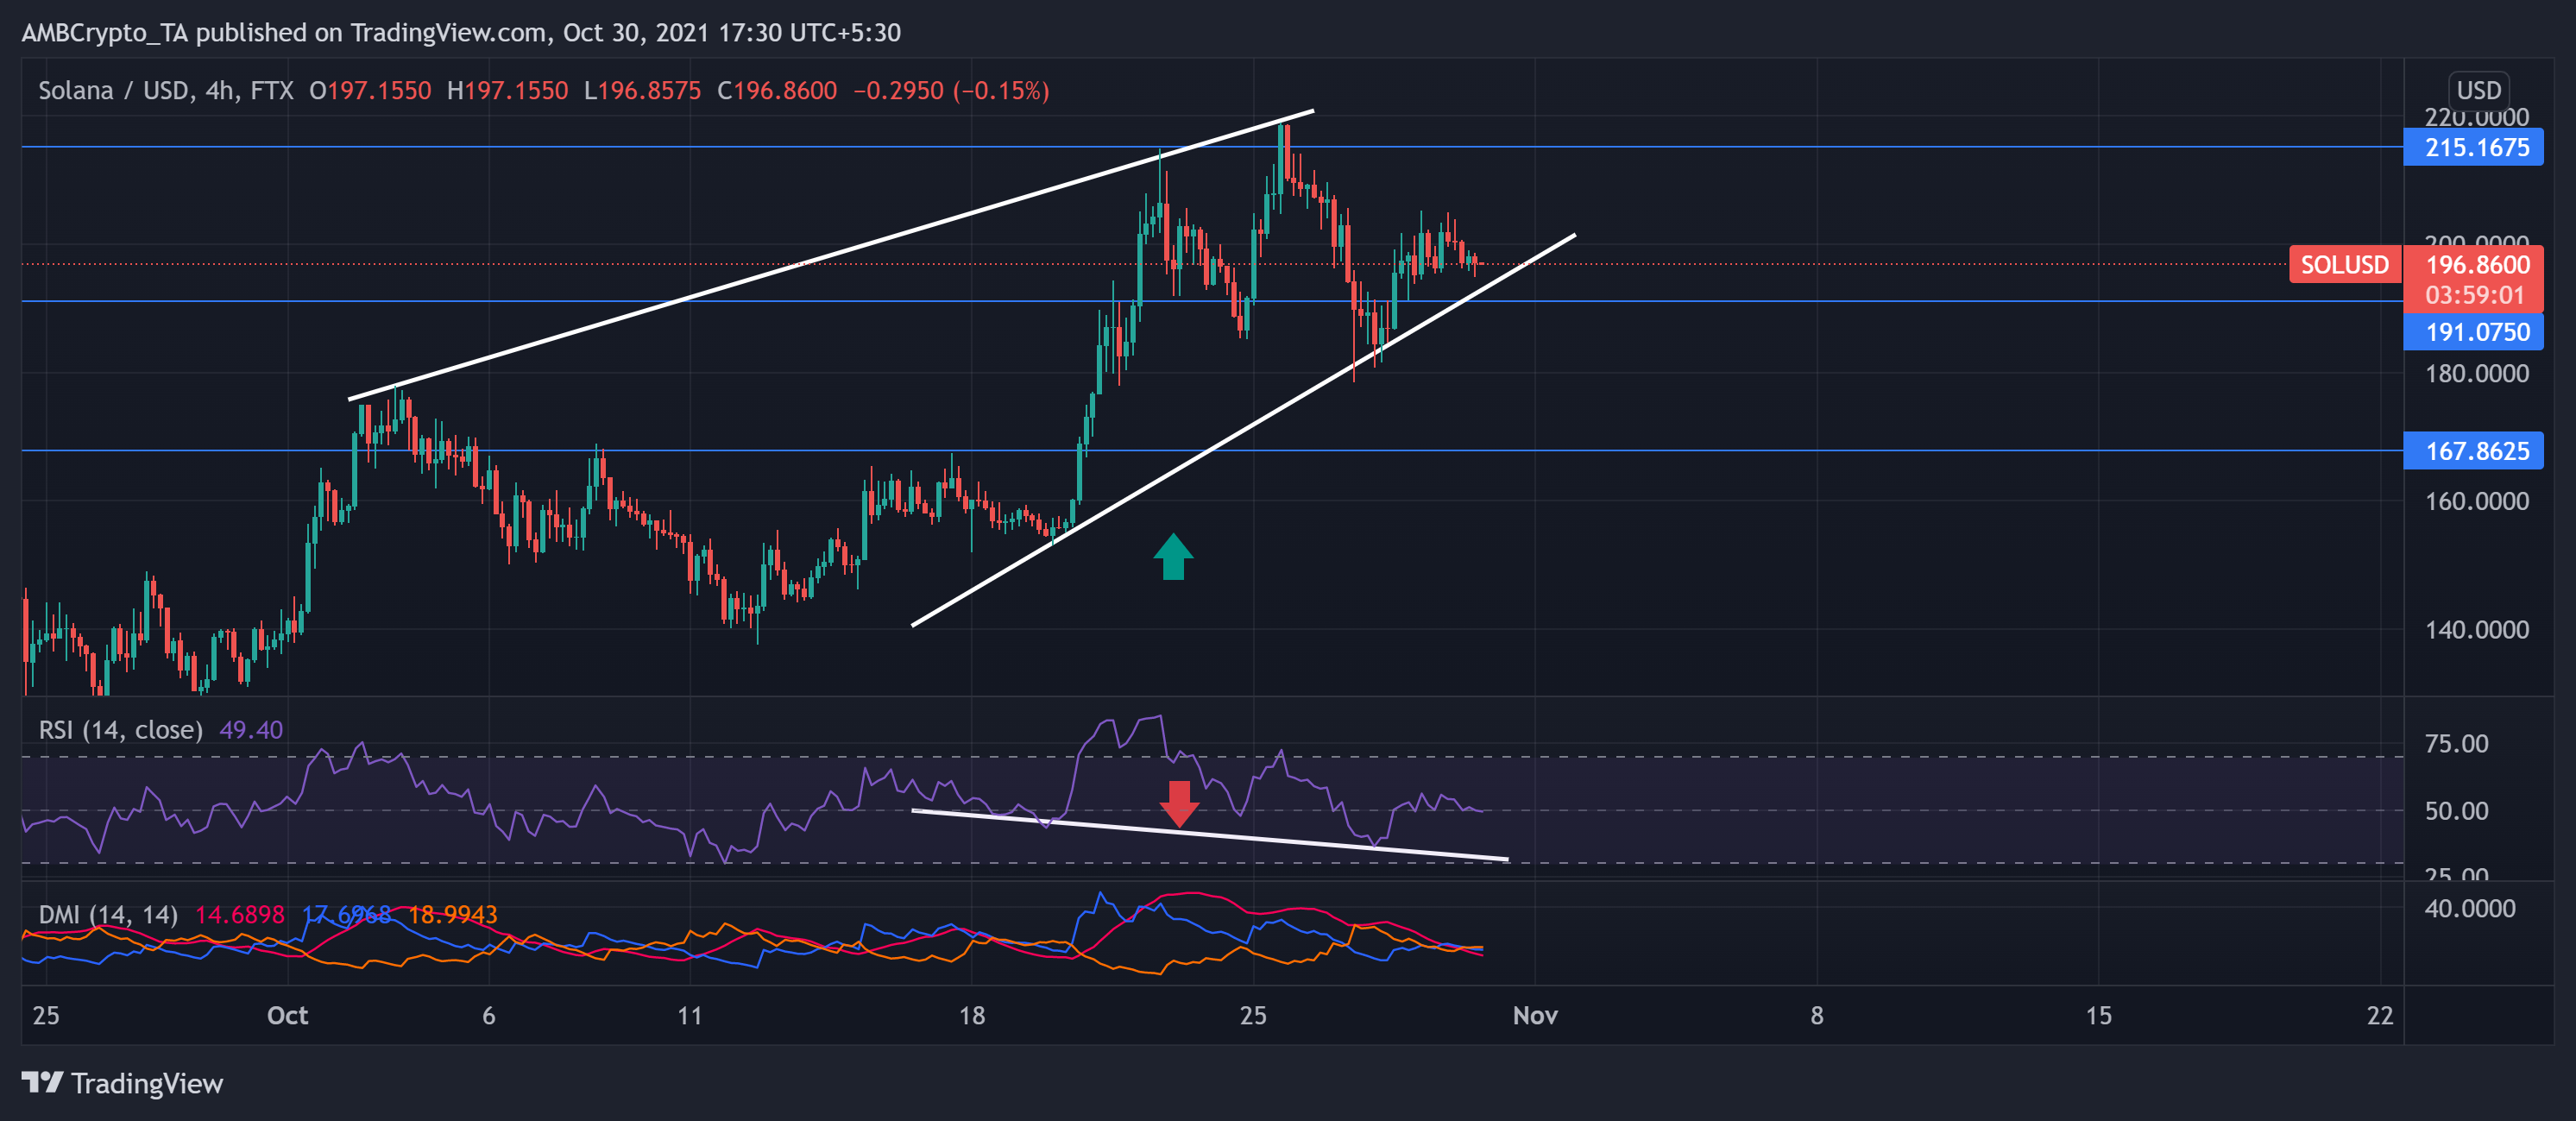
SOL has projected a bullish momentum since the past month as it registered a 39.15% gain on monthly charts. The crypto’s price oscillated in an uptrend marking higher highs and hit its ATH on 25 October at $218.92. Then, it plunged towards the lower trendline and bounced back from it.
At press time, the digital currency traded at $0.00 and noted $215.1675 as its resistance point. Key technicals point towards decreasing buying power in the near term.
The RSI stood near the midline after following a downtrend.
Additionally, DMI indicated a slight preference for the sellers. However, the ADX line stood at the 15-mark and suggested a weak directional trend.