Cardano: Should you buy the dip or sell the rip in the weeks to come

Disclaimer: The findings of this analysis are the sole opinions of the writer and should not be considered investment advice.
USD Tether’s dominance rose past the 5% mark. It was at 5.3% in mid-July, when Bitcoin traded at $29k and Cardano at $1. This all-important psychological level of support has given way in recent days, and bears were in the ascendancy once again. The sellers have shown repeatedly that Cardano was a seller-dominated market ever since the $1.94 support level was flipped to resistance in early November.
ADA- 12H
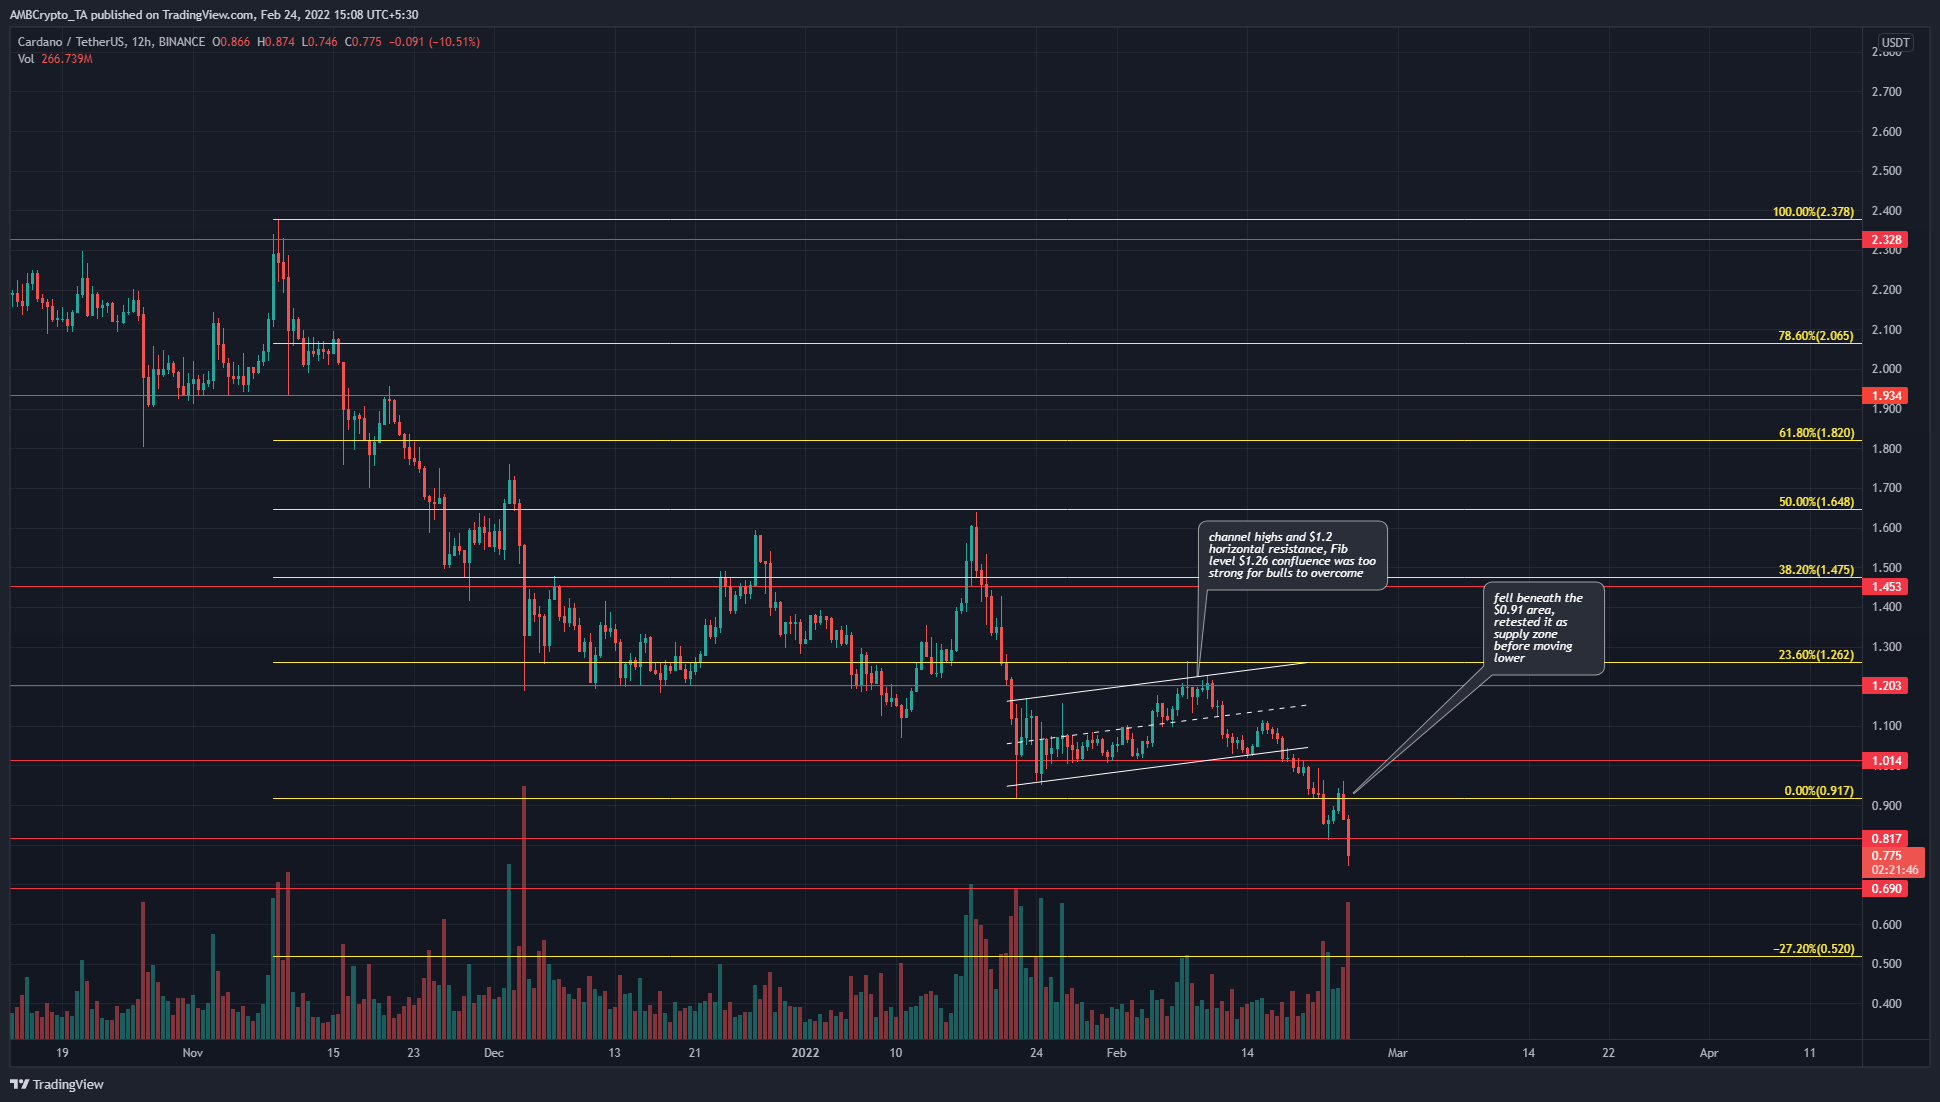
The downtrend for ADA has been present since early November. In mid-February, the $1.2 level was retested as support when the bulls tried to flip the short-term market structure to bullish but faced intense selling at $1.2. This was when the price traded for a few weeks within an ascending channel (white).
Since that failure to breach $1.2, the price dropped to $1- a weakened support level due to the repeated tests of this level in January. The market-wide fear propelled ADA beneath $1. Primarily, beneath the $0.91 level (January lows), and since then $0.91 was retested as resistance.
The Fibonacci extension level of 27.2% (yellow) lay at $0.52- with $0.81 and $0.69 being levels of significance in between.
Rationale
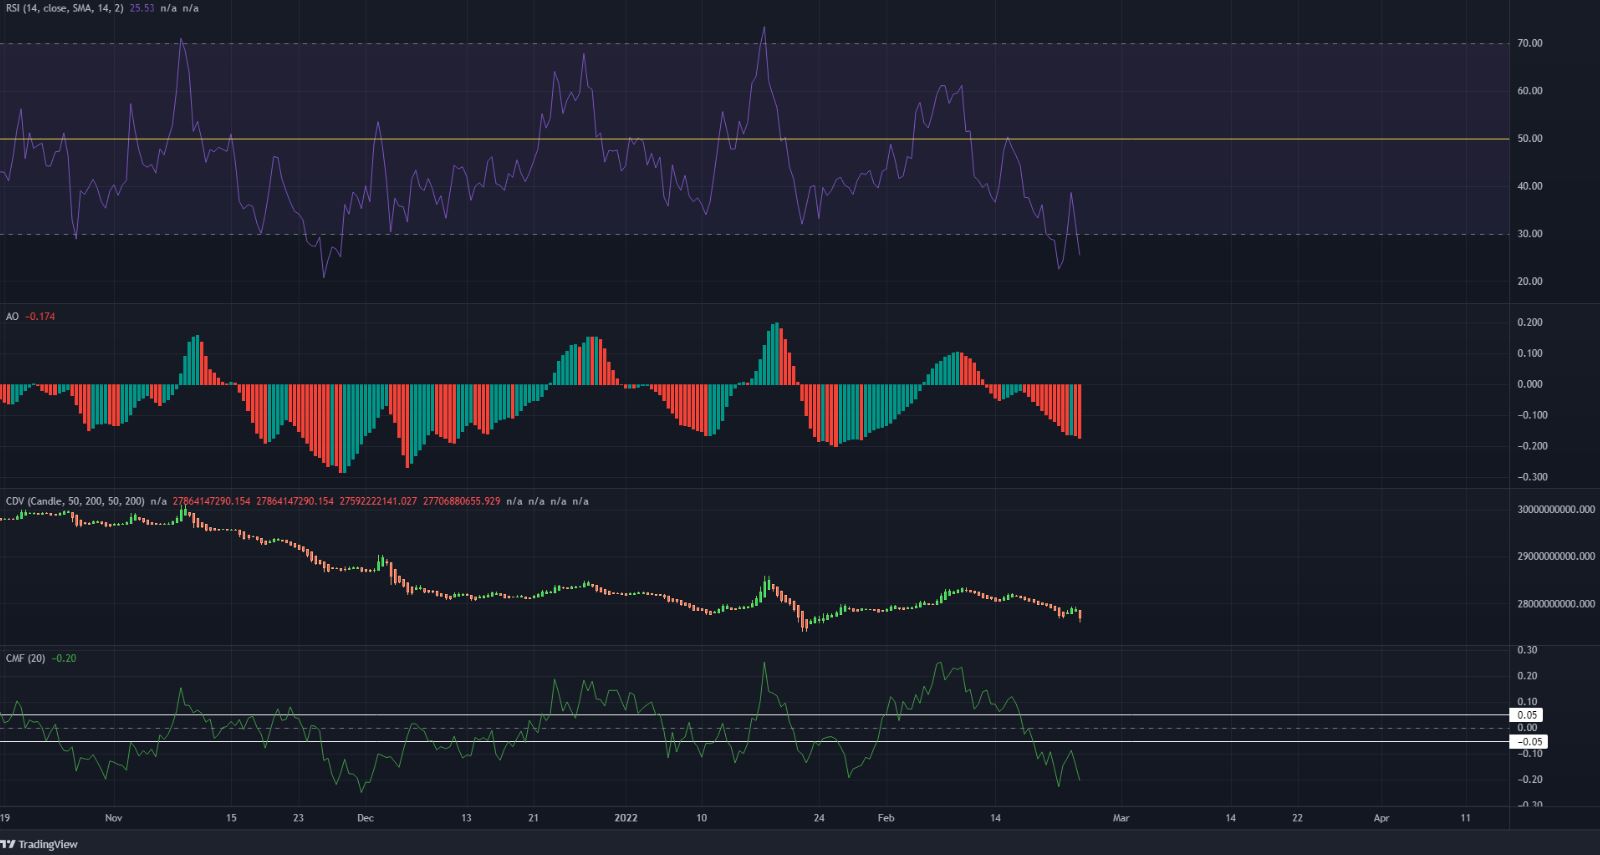
The RSI had tried to claw its way back above neutral 50 in February, but was unable to climb past 60 – so the momentum did not cross into the “strongly bullish” threshold in recent weeks despite the bounce in early February. At the time of writing, the RSI had bounced from oversold territory and could display a bullish divergence in the days to come.
The Awesome Oscillator registered red bars on its histogram as bearish momentum climbed in the past week, while the CDV also showed selling volume was dominant. The Chaikin Money Flow was also beneath -0.05.
Conclusion
Overall, the indicators showed bearish momentum and significant selling pressure on ADA. A possible retest of the $0.91 or $0.81 levels could present a shorting opportunity. Long-term investors would not be impressed by the market structure of the coin on the charts, and risk-averse investors might need to wait for a while for this structure to shift.