Cardano, Solana, Axie Infinity Price Analysis: 5 November


While the overall crypto market did not flash high volatility, many altcoins displayed mixed trading signals.
Cardano technicals projected an overall bearish picture. On the other hand, altcoins like Solana and Axie Infinity (AXS) depicted bullish tendencies and reached their ATH. While Solana’s technicals hint at possible ease in bullish momentum, AXS technicals flashed mixed signals.
Cardano (ADA)
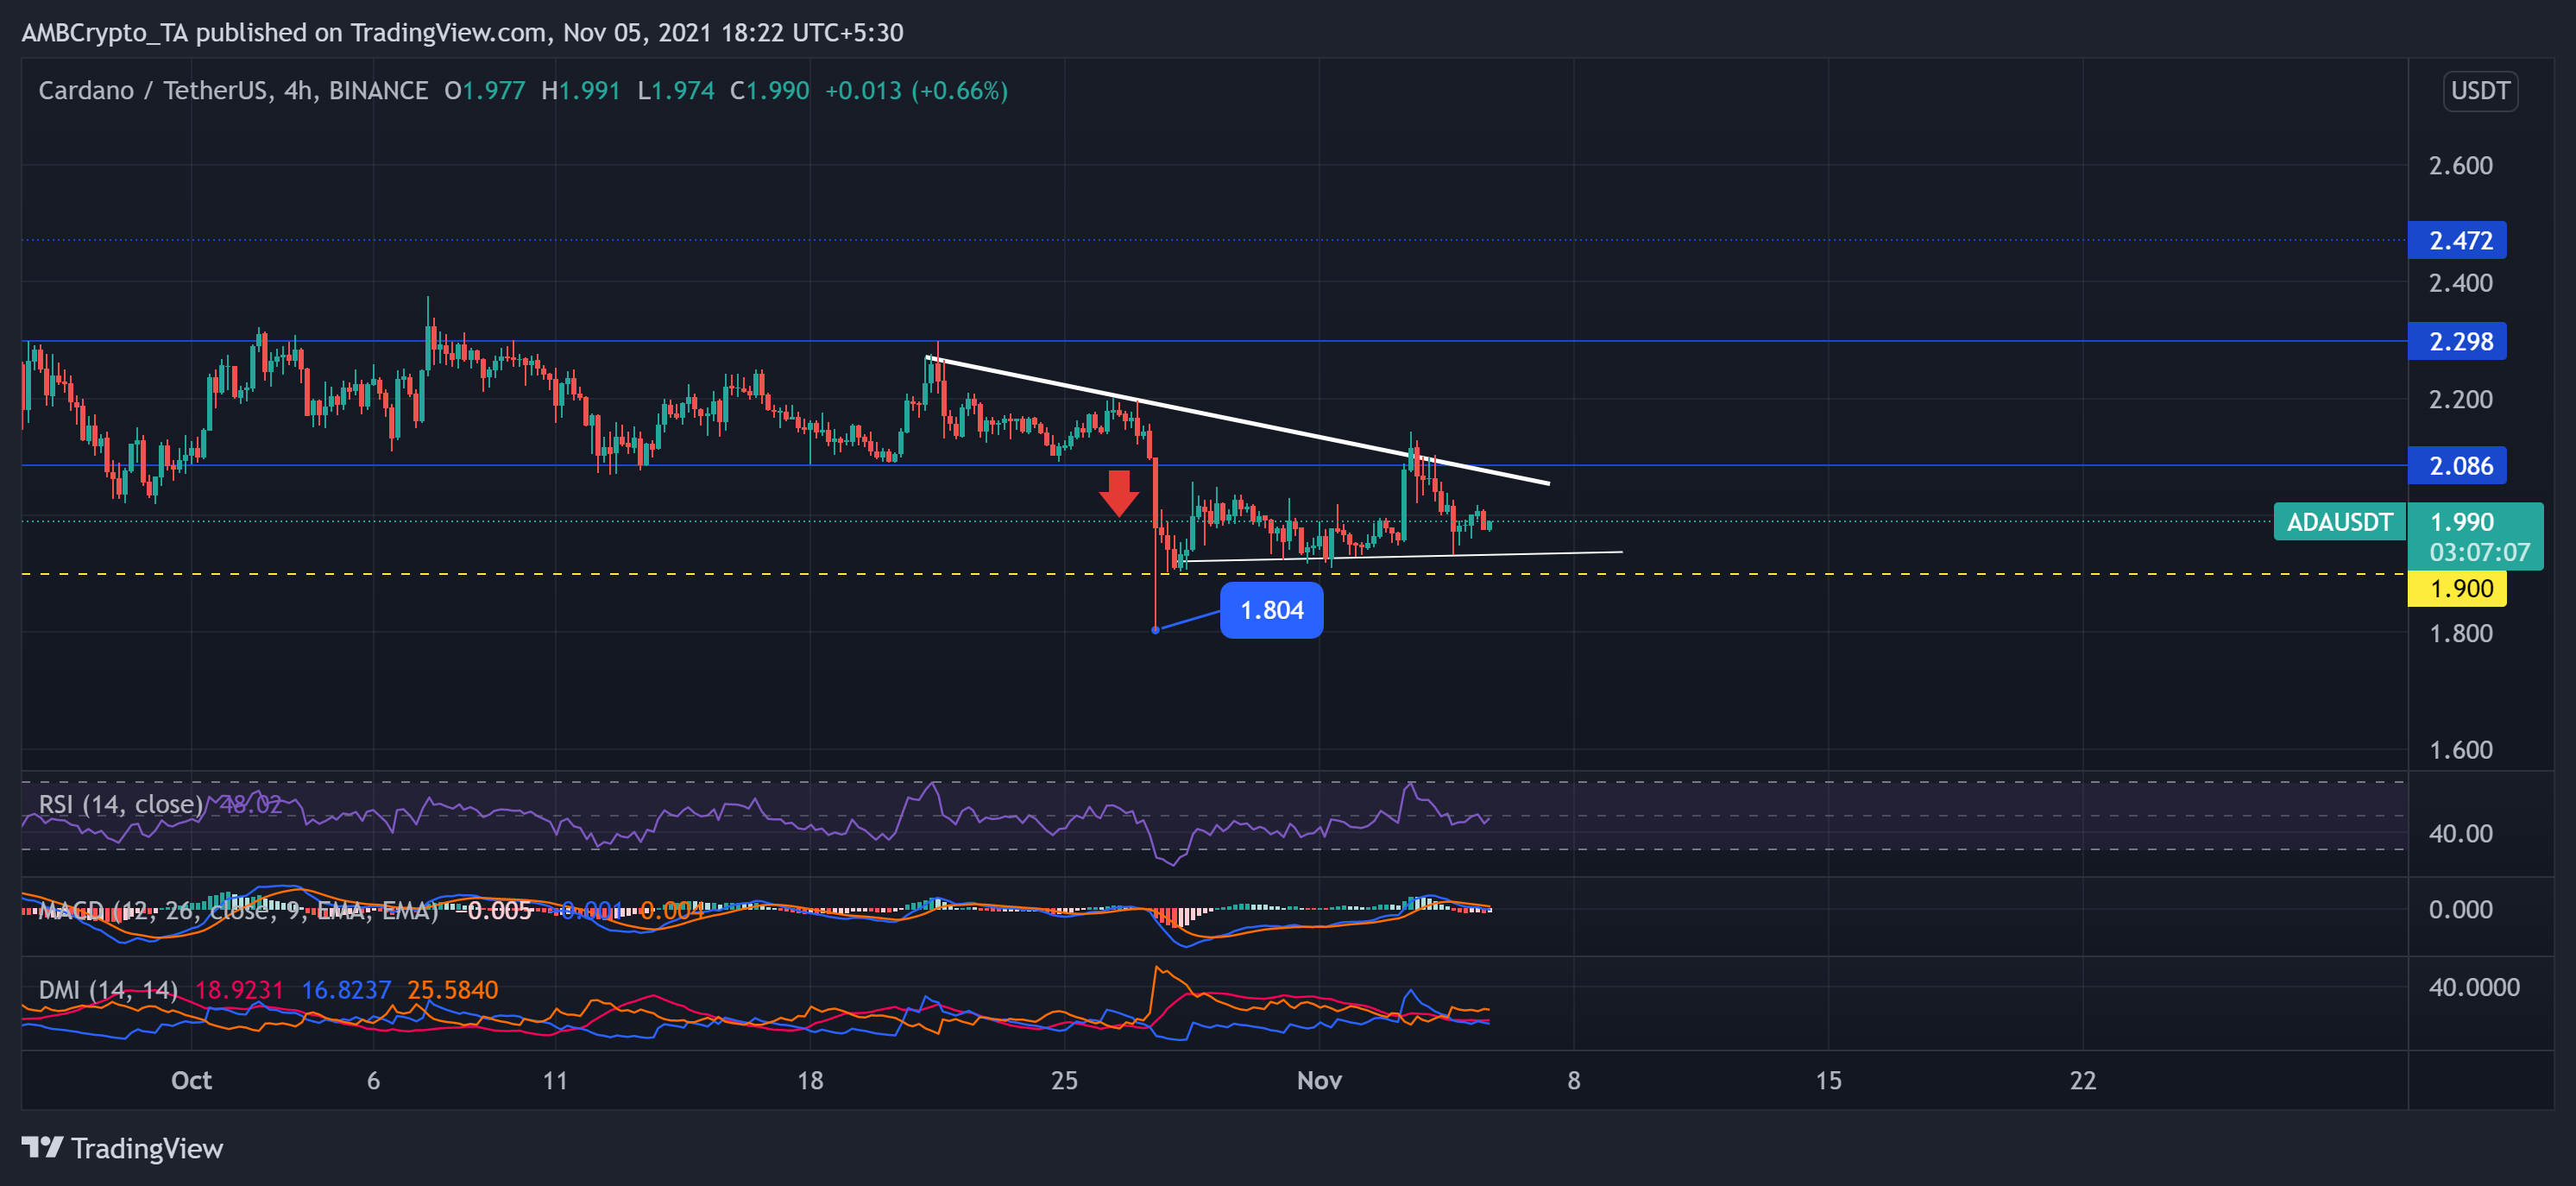
The smart contracts platform was not performing well over the past month. Consequently, it got flipped by Solana and registered an 11.1% loss on its monthly charts. Since 21 October, the price swung in a descending triangle pattern. As a result of which it saw a 7.5% decline over the past 14 days.
As the bears sustained their pressure, they breached its immediate resistance of $2.086 and found support at $1.9. After touching its eleven-week low, ADA bulls showed some vigor but did not breach the $2.08-mark.
At press time, ADA traded at $1.99 after declining by nearly 1.7% in 24 hours. Near-term technicals affirm the preference for the sellers.
The RSI dipped below the midline and saw a 12 point plunge over the last day. Additionally, MACD and DMI lines indicate a preference for the selling strength. However, the ADX stood at the 18-mark and suggested a weak directional trend.
Solana (SOL)

SOL has projected a bullish momentum since 5 October as it registered a 53.81% gain on monthly charts. The altcoins price oscillated in an uptrend between the two parallel channels. Consequently, it marked higher highs and hit its ATH on 5 November at $250.5325. Then, it plunged towards the lower trendline and found support at $215.1675.
At press time, the digital currency traded at $238.57 after registering a 1.5% loss in 24 hours. Key technicals point towards possible ease in bullish momentum in the near term.
The RSI saw an eleven-point decline as it dipped from the overbought territory toward the midline. Additionally, MACD and the AO histograms displayed red signals and reaffirmed the decreasing buying power. However, DMI lines continued to prefer the buyers with a high ADX level.
Axie Infinity (AXS)
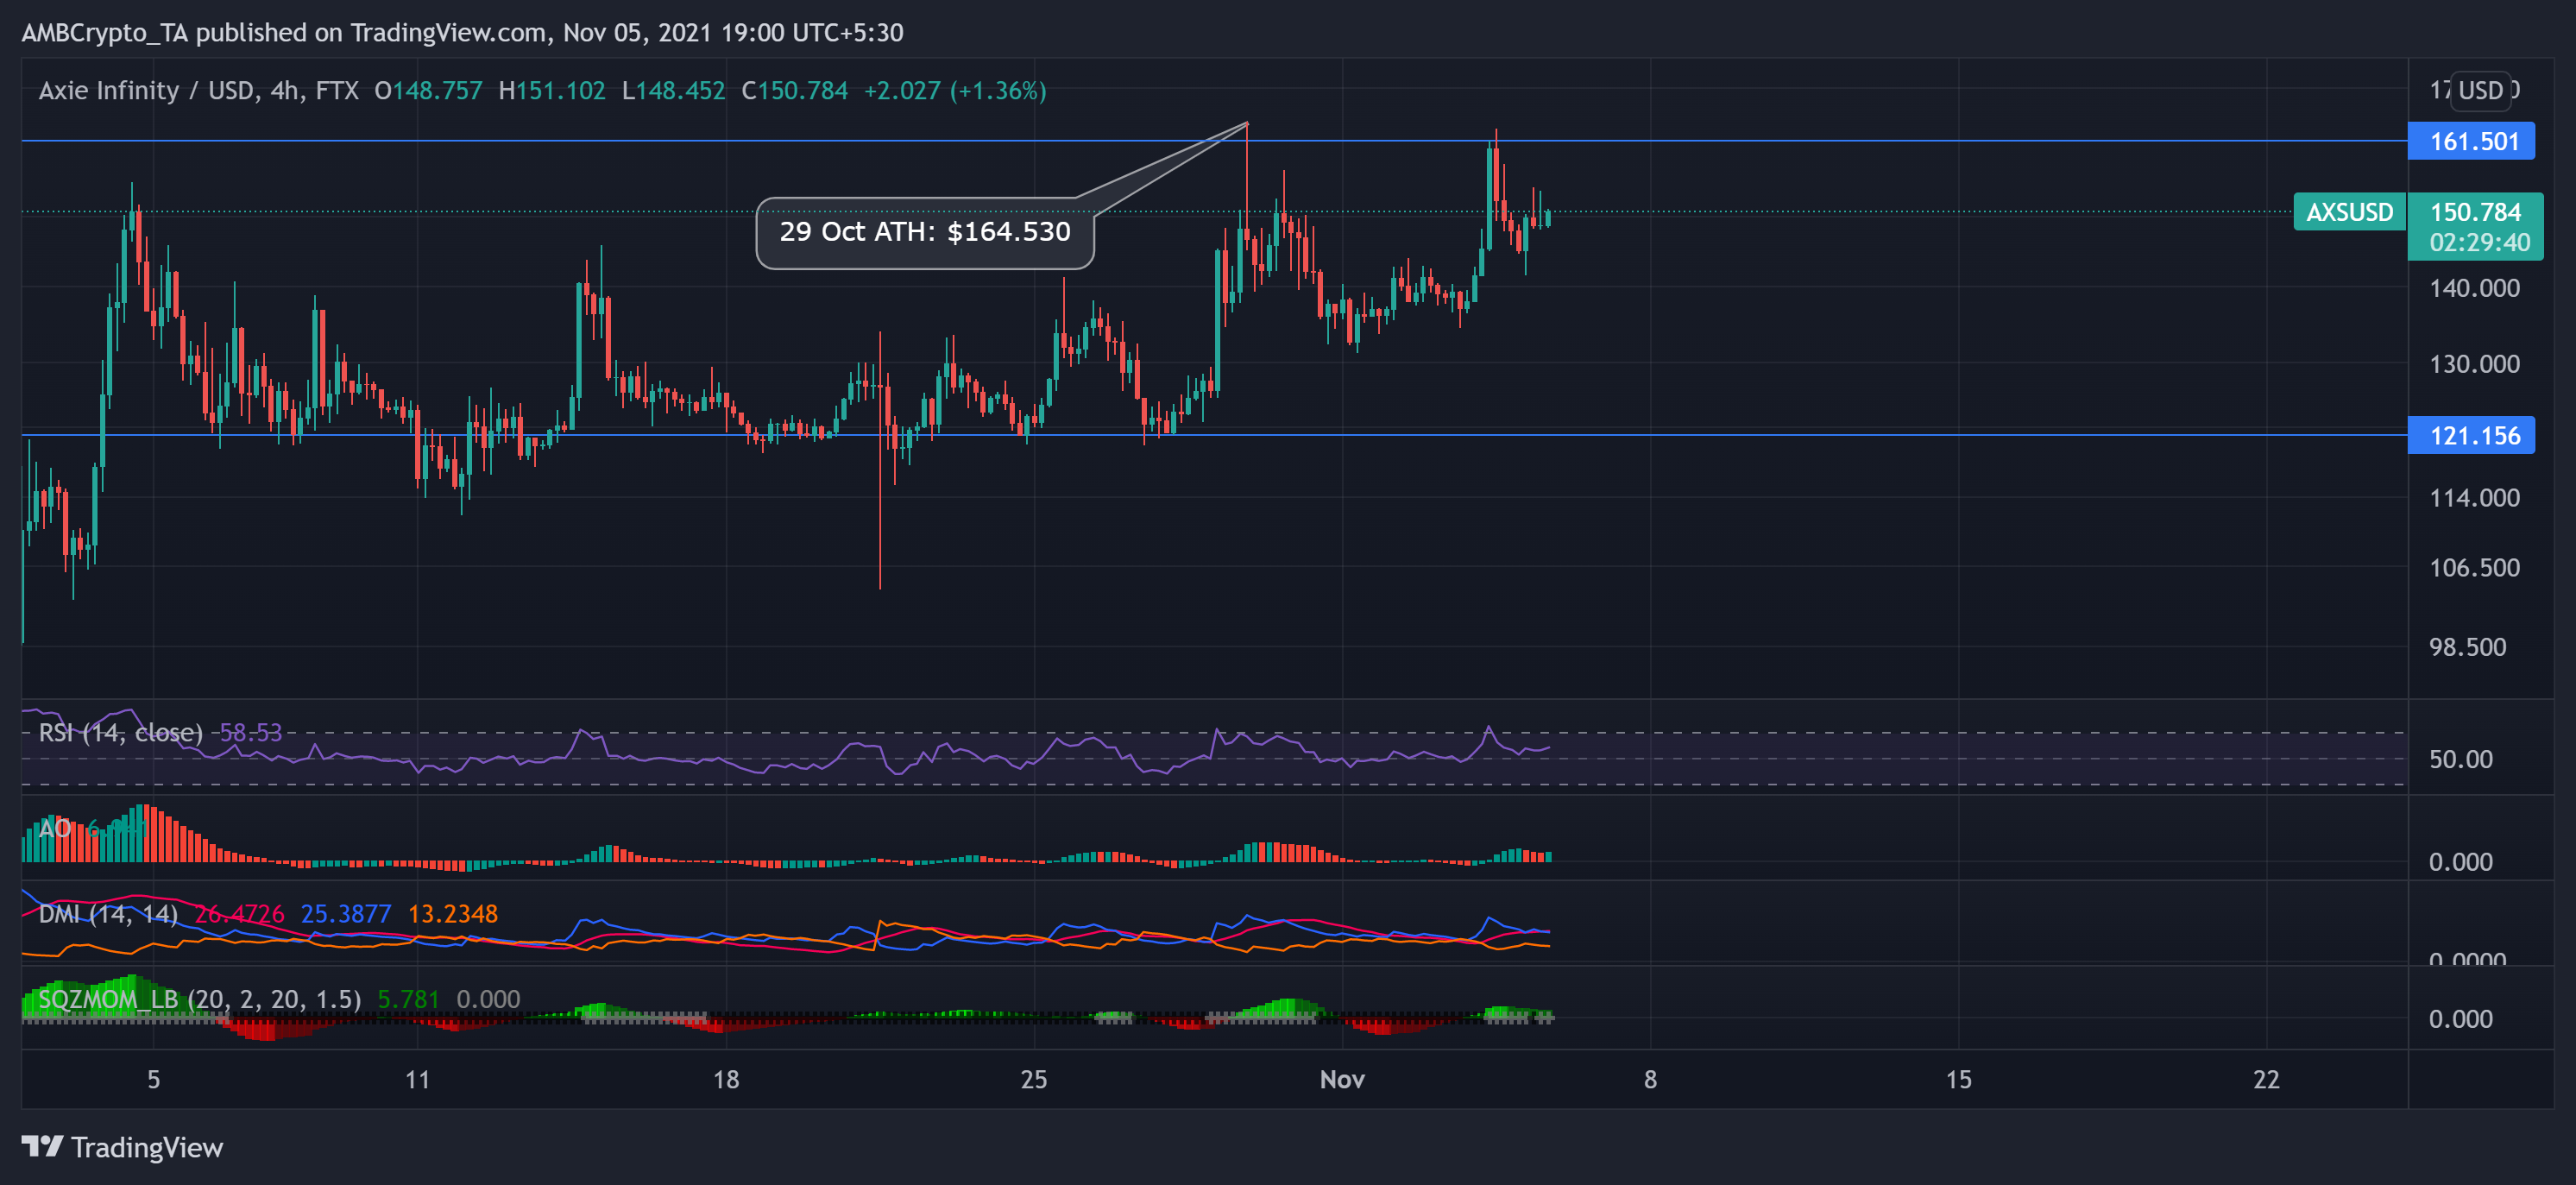
The Ethereum based cryptocurrency AXS traded at $150.784 and noted a 1.6% gain on its charts in the last 24 hours. Over the past month, AXS fluctuated between $121.156 and the $161-mark until it reached its ATH on 29 October. However, AXS bulls exerted constant pressure while the bears showed resistance at the $161-mark.
The RSI stood above the midline after plunging by 17 points over the past day. Furthermore, the AO flashed a green signal and suggested decreasing selling pressure. Additionally, the DMI lines also exhibited an inclination for the buyers and confirmed the previous readings.
However, the Squeeze Momentum Indicator displayed dark green bars that seemed to approach the zero line in a momentum phase.