Cardano, Solana, Tron Price Analysis: 16 December

Over the past day, Cardano and Solana led the recovery phase by bagging double-digit gains, at press time. On the other hand, Tron remained below the $0.089 level while flashing weak technicals.
Cardano (ADA)
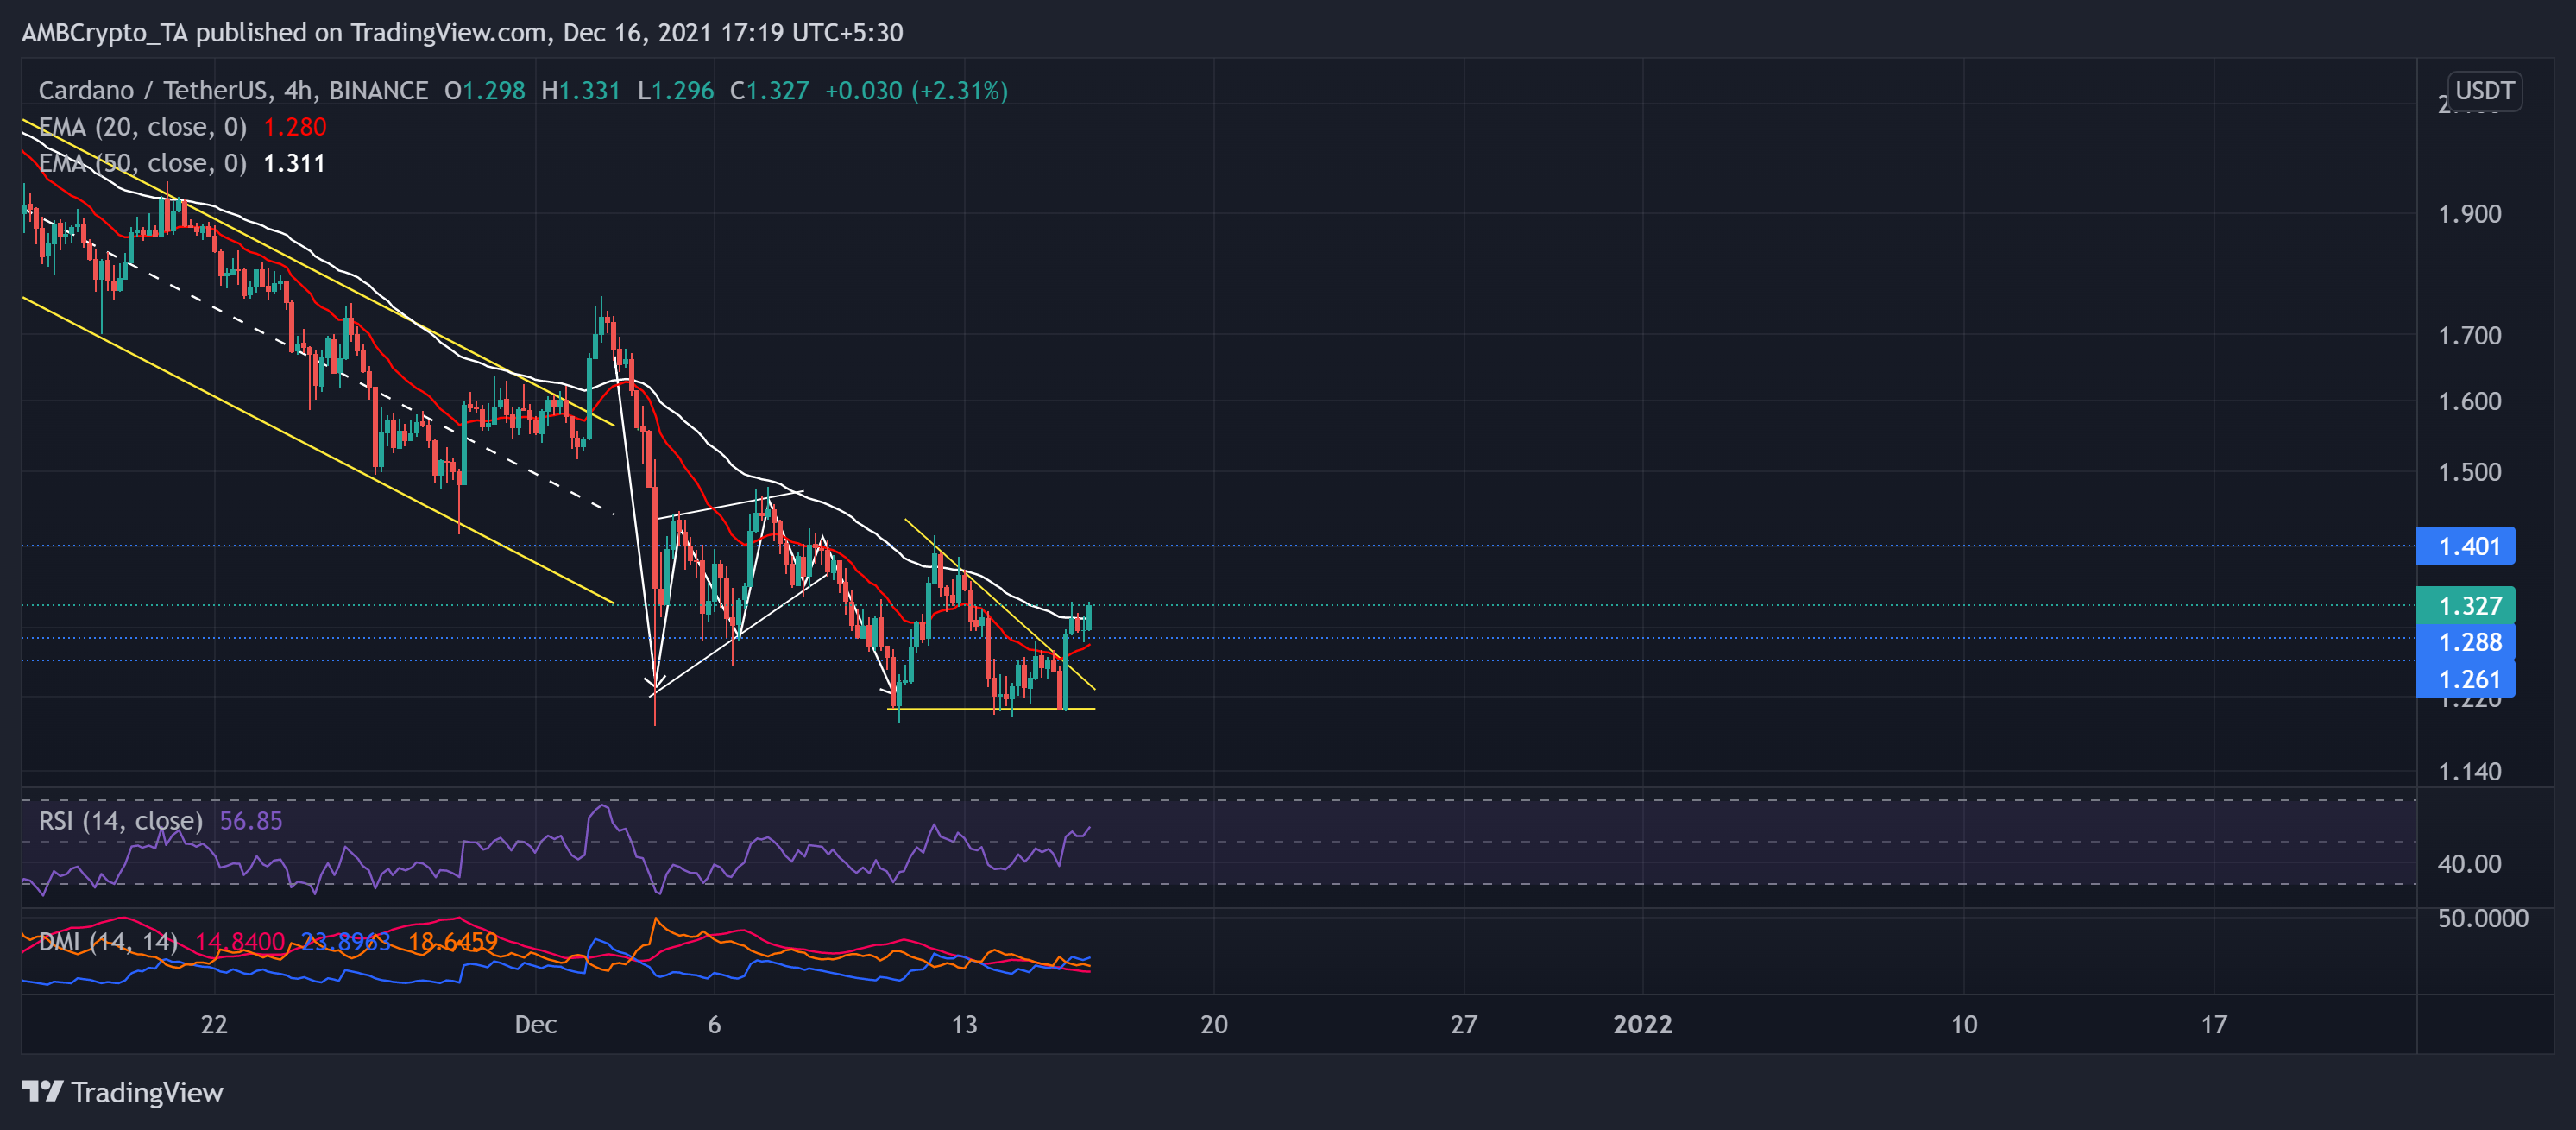
ADA halted its bearish streak after a descending triangle breakout on its 4-hour chart over the past day. The altcoin saw a nearly 10% jump over the past day.
After a 13.05% breakdown from the rising wedge, the price action steeply plunged to poke the $1.19-mark on 11 December. The bulls retested the $1.26-mark (20-week resistance) four times before initiating a breakout.
At press time, ADA traded at $1.327. The RSI exhibited a bullish inclination and seemed to head north. Further, the DMI implied a buyer’s market but flashed a weak directional trend. The recent bullish move pushed the price above the 20-50 EMA while ADA looked at an immediate resistance at the $1.4-mark.
Solana (SOL)

SOL bears increased the selling pressure over the last month as the alt touched its lifetime milestone on 6 November. As a result, the alt registered a 22.3% 30-day decline.
The alt plummeted by marking a down-channel (yellow). After which, it plummeted to poke its eight-week low on 13 December. Over the past few days, the altcoin saw an 18% breakout from the descending broadening wedge after an up-channel (white) breakdown. The bulls were quick to snap the immediate $181 support and now found resistance at the $192-mark.
At press time, SOL traded at $186.075. The RSI plunged toward the 65-region after preferring the bulls. Also, the DMI resonated with the bullish RSI readings.
Tron (TRX)

AS the bulls failed to uphold the ten-week resistance at the $0.0899-mark, TRX consolidated between the $0.082 and the aforestated mark.
TRX price action saw a sharp plunge after poking its six-month high on 15 November. After falling in a descending channel (yellow), the alt further saw a breakdown to touch its 16-week low on 3 December. Then, after forming a rising wedge, it witnessed an expected reversal from its bullish trajectory.
At press time, TRX traded at $0.08765 after noting a 1.25% gain on its daily chart. The RSI moved sideways near the midline after flashing neutral signs. Further, the DMI depicted a marginal bearish preference, but the ADX displayed a weak directional trend.