Cardano
Cardano: This price pattern hints at big gains – Will ADA break out?
Cardano was about to break above a multi-month bullish pattern. But will this latest correction cause trouble?

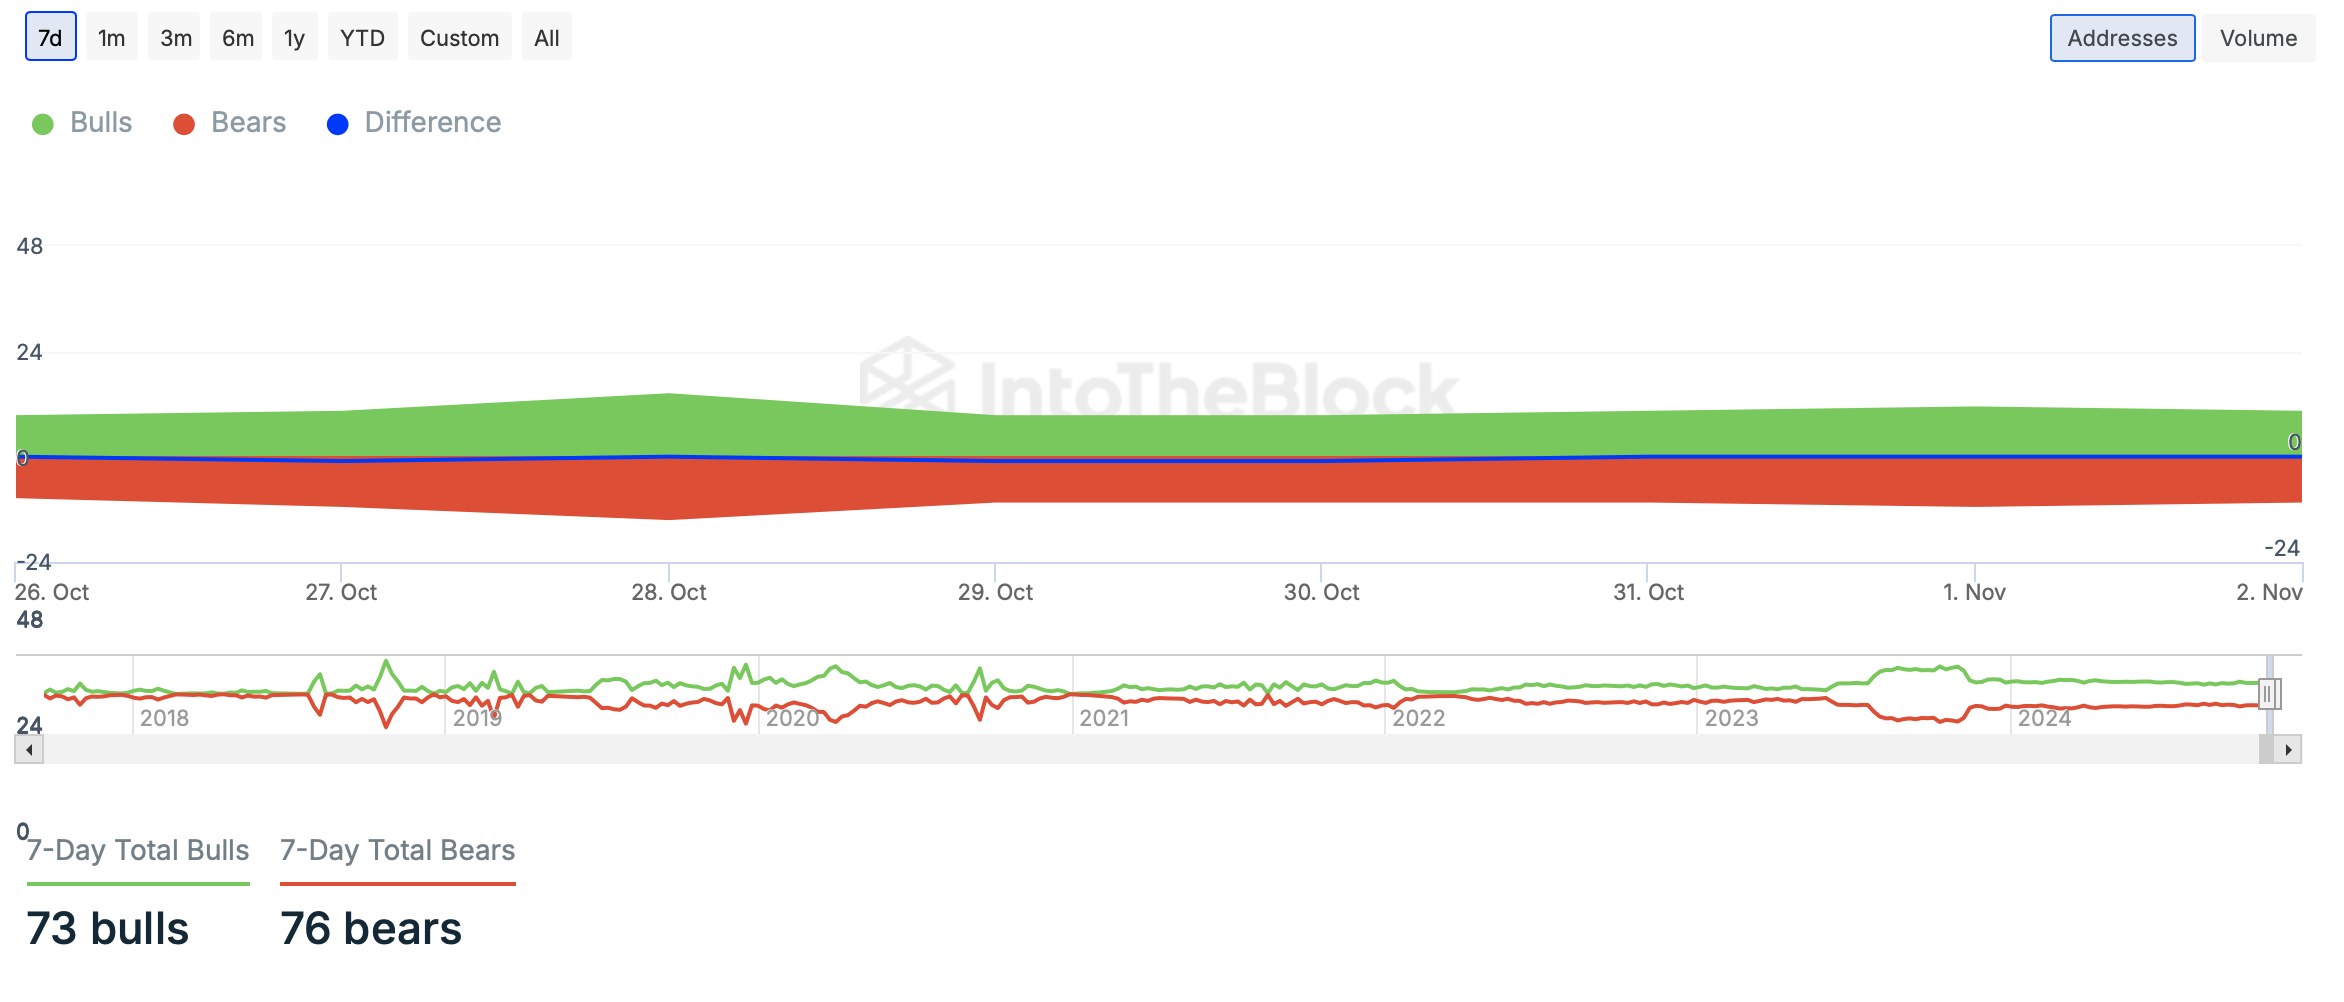
- Cardano bears dominated the bulls last week.
- Several metrics and indicators hinted at a trend reversal.
As the market continued to remain somewhat bearish, Cardano [ADA] was one of the worst hit among the top altcoins. But investors should remain patient, as ADA was consolidating inside a multi-month pattern.
A breakout could spark a rally, which might allow ADA to regain its lost value.
Cardano bulls to wake up soon?
InToTheBlock’s data revealed that over the last seven days, the number of ADA bulls and bears remained more or less the same. That being said, the number of bears was slightly higher.
This could have played a role in ADA’s latest price correction. The token’s value dropped by more than 4% in the last 24 hours and was trading at $0.3438.
Because of the latest price correction, 563.8k Cardano addresses remained in profit, which accounted for only 12% of the total number of ADA addresses.
However, there was still hope of a revival soon. World Of Charts, a popular crypto analyst, recently posted a tweet highlighting a notable development. As per the tweet, a multi-month bull pattern appeared on ADA’s price chart.
The pattern first emerged in late December 2023, and since then ADA’s price has been consolidating inside it.
At the time of writing, the consolidation range became tighter as the token was trying to break out. In case of a breakout, then investors might soon witness Cardano’s price jumping above $0.5.
If the rally sustains, then ADA might as well register an overall 90% bull rally.
Apart from this, AMBCrypto reported earlier that ADA was mimicking a pattern that it followed back in 2020. This suggested a potential surge starting in mid-November, coinciding with the U.S. elections.
What metrics suggest
AMBCrypto then planned to assessed Cardano’s on-chain data to find out whether they hint at a trend reversal, which could allow ADA to breakout.
Our analysis of Santiment’s data revealed that ADA’s trading volume dropped in double digits while its price fell. Its open interest also followed a similar declining trend.
Both of these metrics, when they decline along with an asset’s price, indicate that the chances of a bullish trend reversal are high.
Additionally, whale activity around Cardano also remained up, which was evident from its stable whale transaction count over the last seven days.
Read Cardano’s [ADA] Price Prediction 2024–2025
To see whether technical indicators also told a similar story, we analyzed ADA’s daily chart. As per the Bollinger Bands, ADA was testing its 20-day SMA resistance at press time.
Though the token was in a less volatile zone, a breakout above that resistance could trigger a bull rally.


