- Cardano’s lowered volatility promised a sharp price move soon.
- The resistance at $0.36 and $0.42 could be pivotal in deciding ADA’s trend.
The 1-week volatility of Cardano [ADA] dropped to a six-week low. Usually, when the volatility dies down, it is a sign that the price is consolidating and gearing up for a strong impulse move.
What could be the direction of ADA’s move, and when could it arrive? AMBCrypto found some patterns that could help plot the move ahead, but the predominant bear trend might not be broken this time.
ADA has bad news for bulls
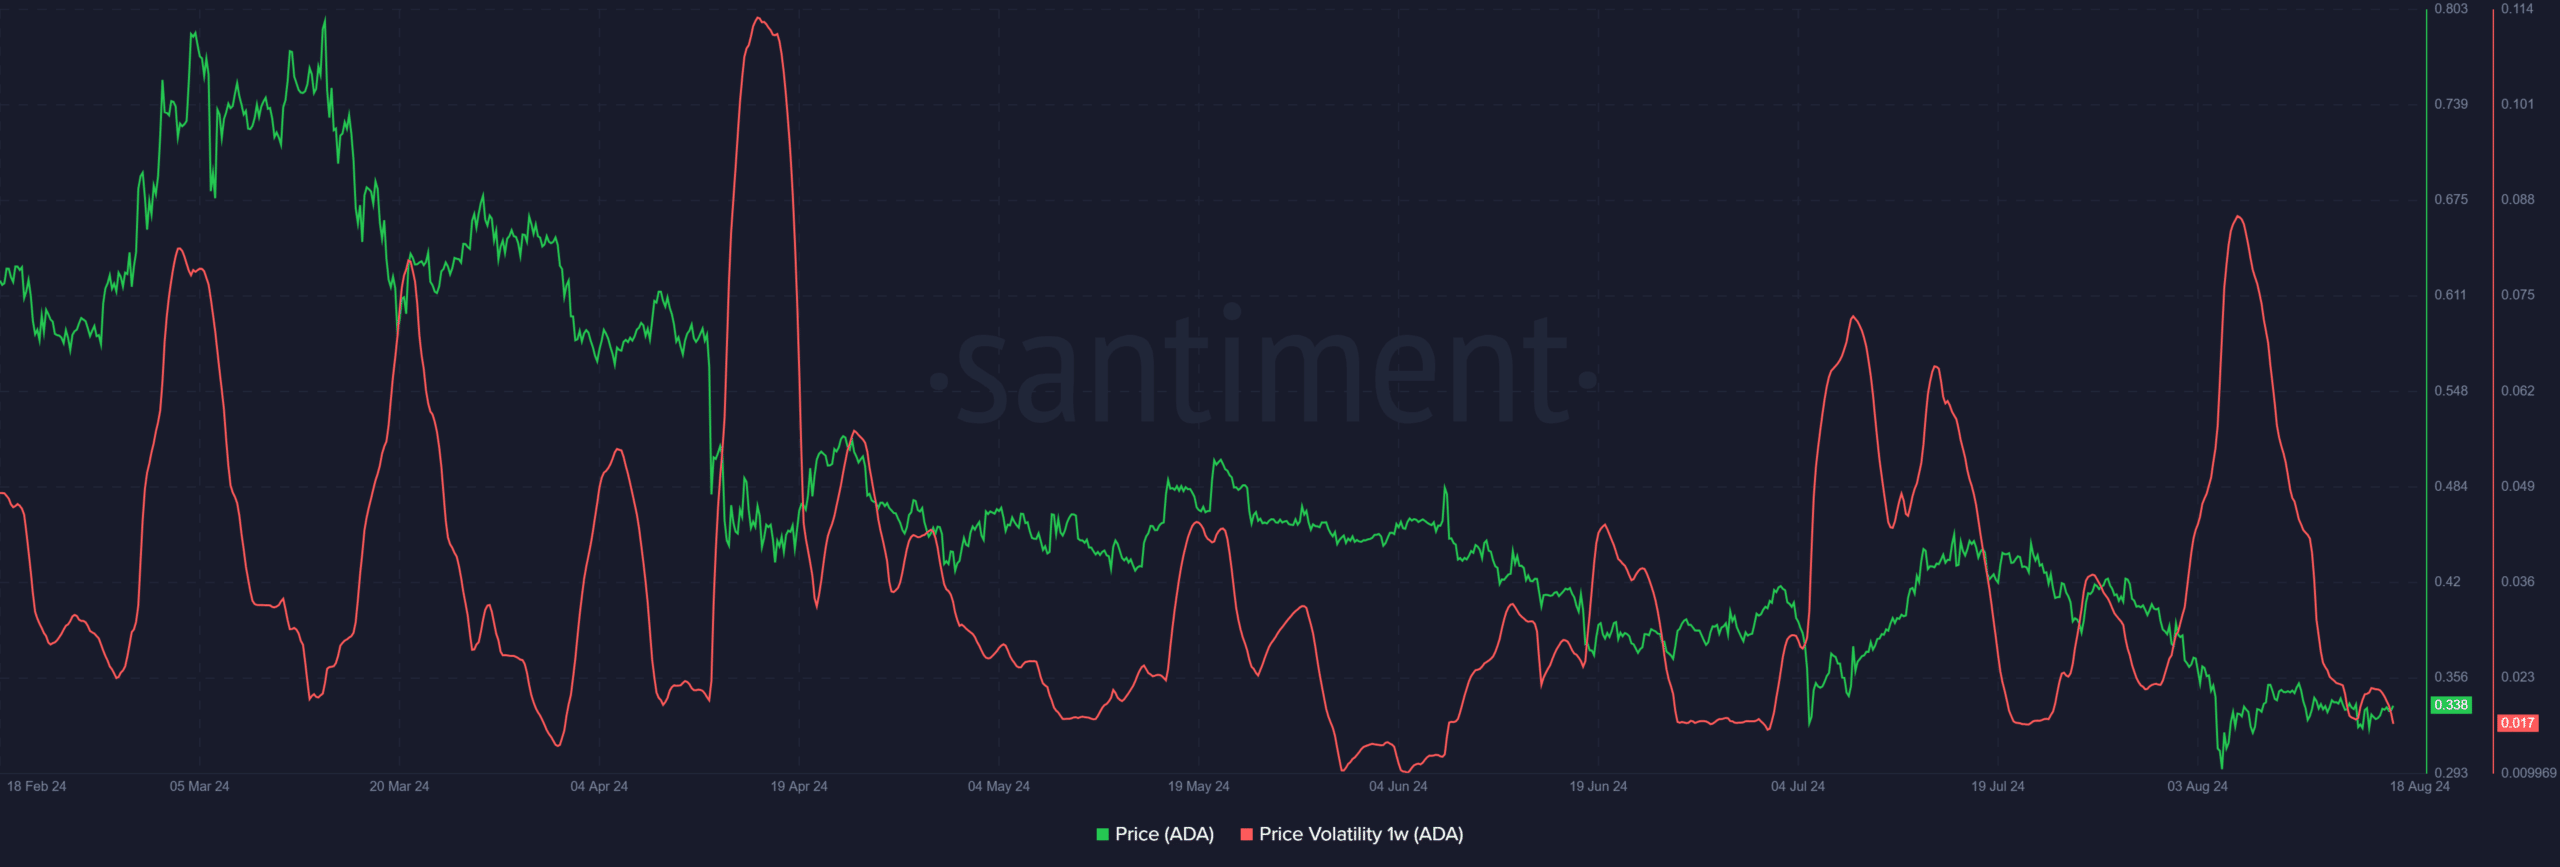
Source: Santiment
Spurts of volatility were witnessed on the 1-week volatility chart to reflect the price moves of Cardano. However, since April, these upticks in volatility did not break the downtrend.
Either they resumed the downtrend or saw a sharp move upward to retest a former support zone.
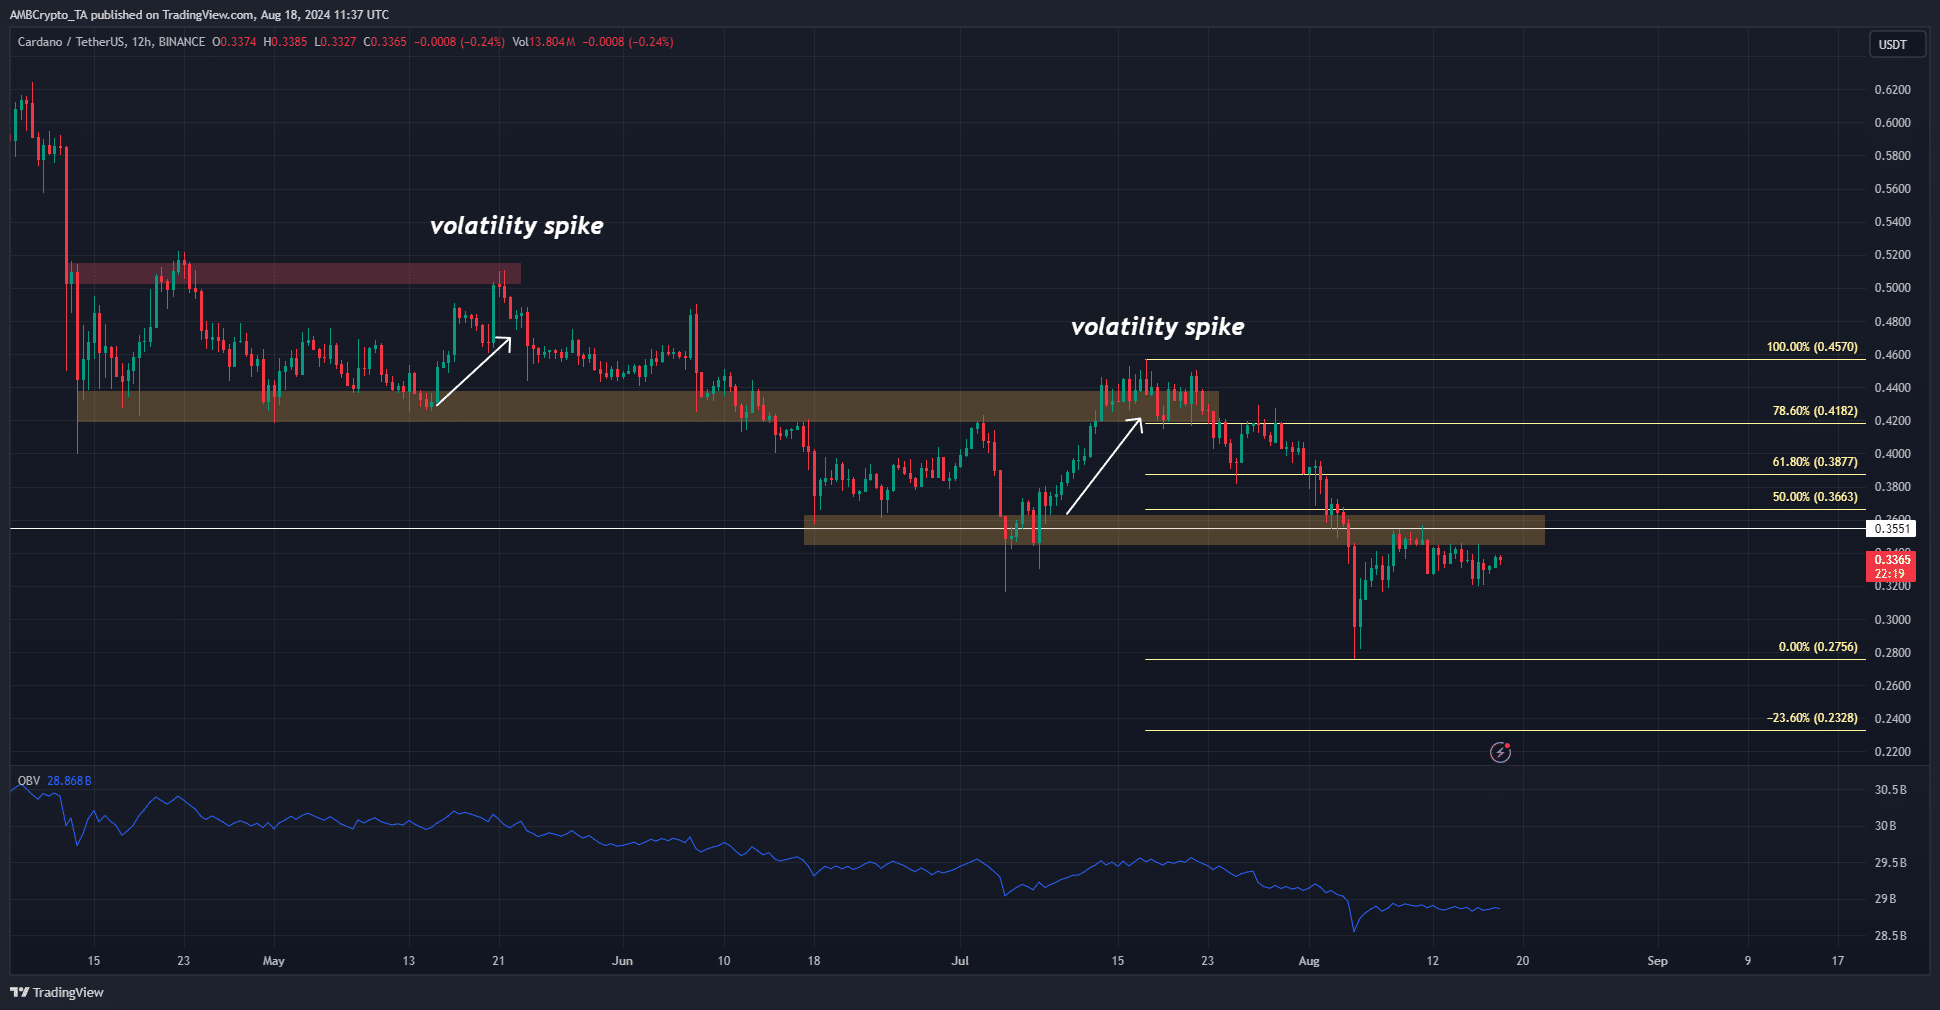
Source: ADA/USDT on TradingView
The 12-hour chart above highlighted two of the largest volatility spikes since May that resulted from an ADA bounce.
We can see that even though the price had time to consolidate, the bulls could not grow strong enough to break the downtrend for good.
This fact was also reflected in the OBV. Each price bounce, at best, retested a recent lower high but did not manage to break out higher.
Now, with the volatility at a six-week low, the most likely scenarios were a bounce followed by a bearish reversal or a move towards the Fibonacci extension level at $0.233.
How high could a potential bounce go?
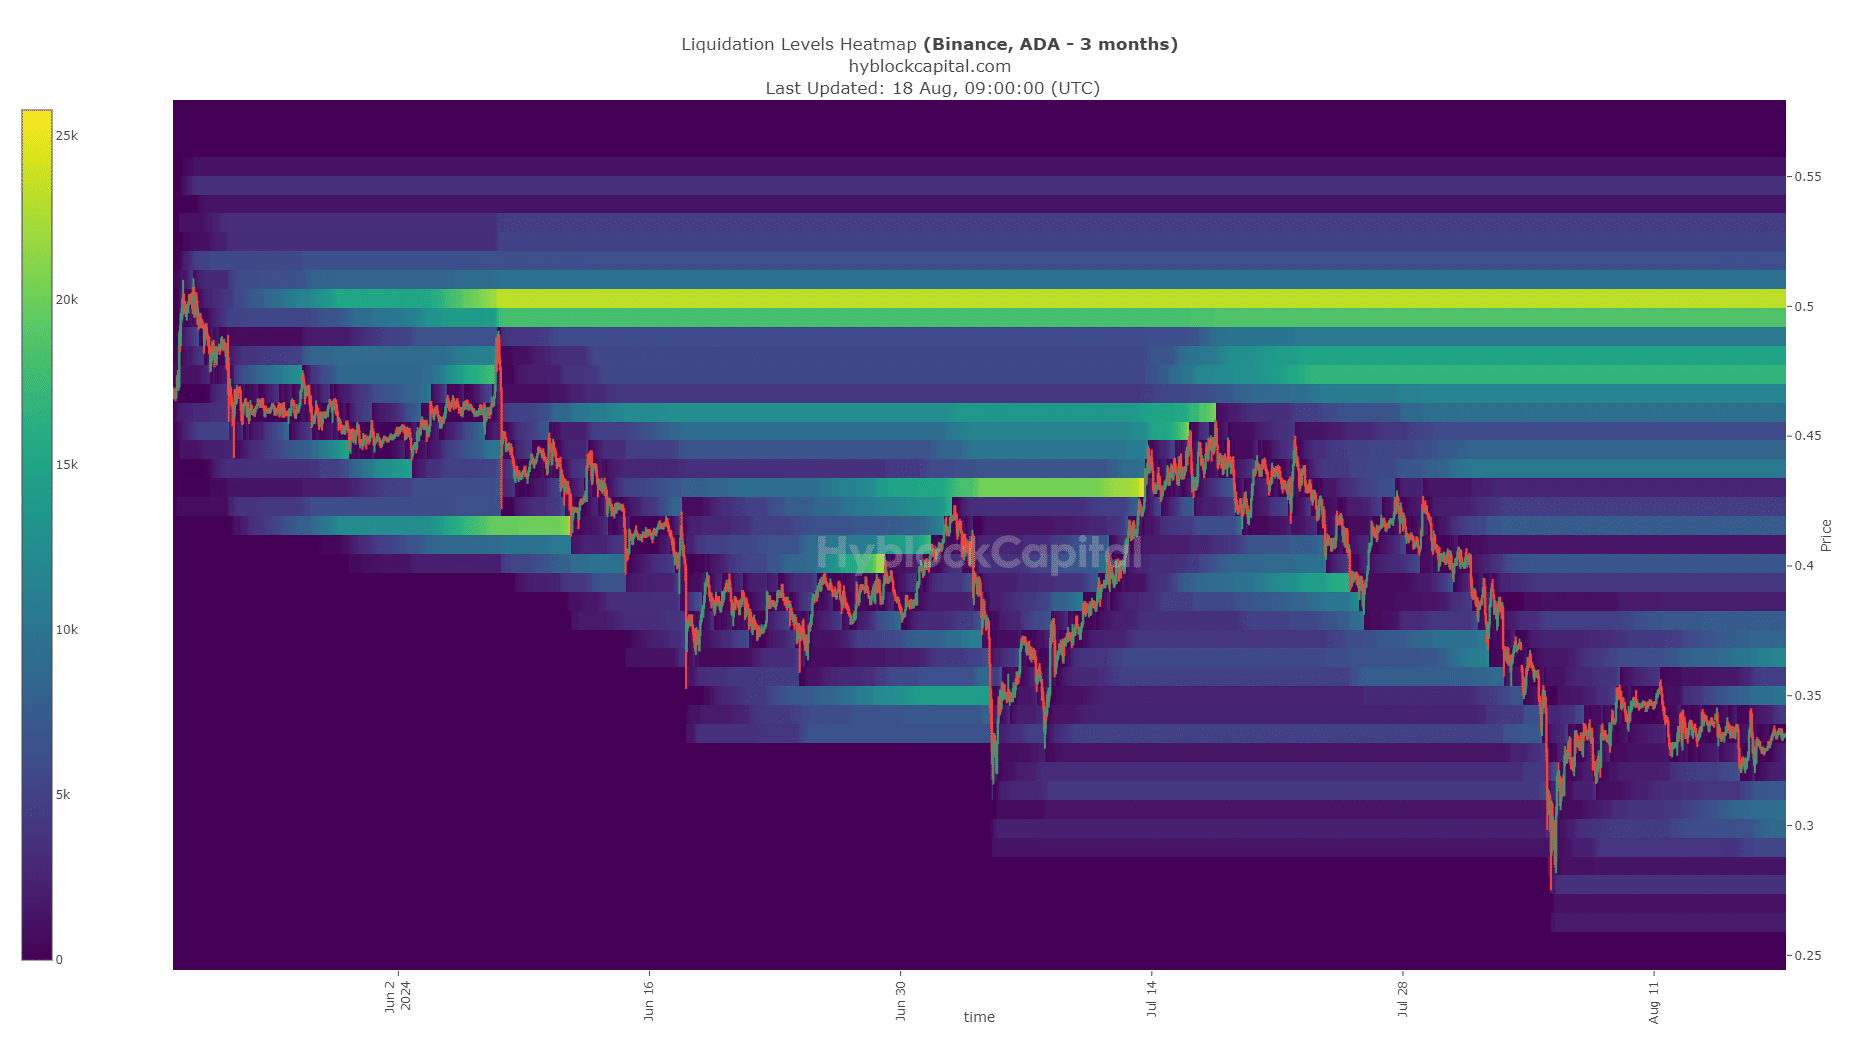
Source: Hyblock
The 3-month liquidation heatmap highlighted $0.365, $0.44, $0.48, and $0.5. The latter two have the highest liquidation level concentration and are the strongest magnetic zones.
The other two lined up with the support/resistance zones highlighted on the 12-hour price chart.
Read Cardano’s [ADA] Price Prediction 2024-25
Cardano swing traders can use the Fibonacci retracement levels at $0.366, $0.387, and $0.418 to gauge the bullish strength.
A jump in weekly volatility would indicate an impulse move was underway, but traders need to wait for a rejection from these resistance levels before looking to go short.