Altcoin
Cardano’s price could go for an upward swing after closure of falling wedge, ascending triangle
Cardano has lost over 23% over a period of seven days and at the time of writing, the altcoin was priced at $0.037 after a decline of 4.10% in the last hour. Despite a steep rise in the latter part of March and a flurry of developments soon after in the Cardano ecosystem, the altcoin failed to top out its previous set resistances and fumbled below $0.05.
Cardano [ADA] 1-hour Chart:

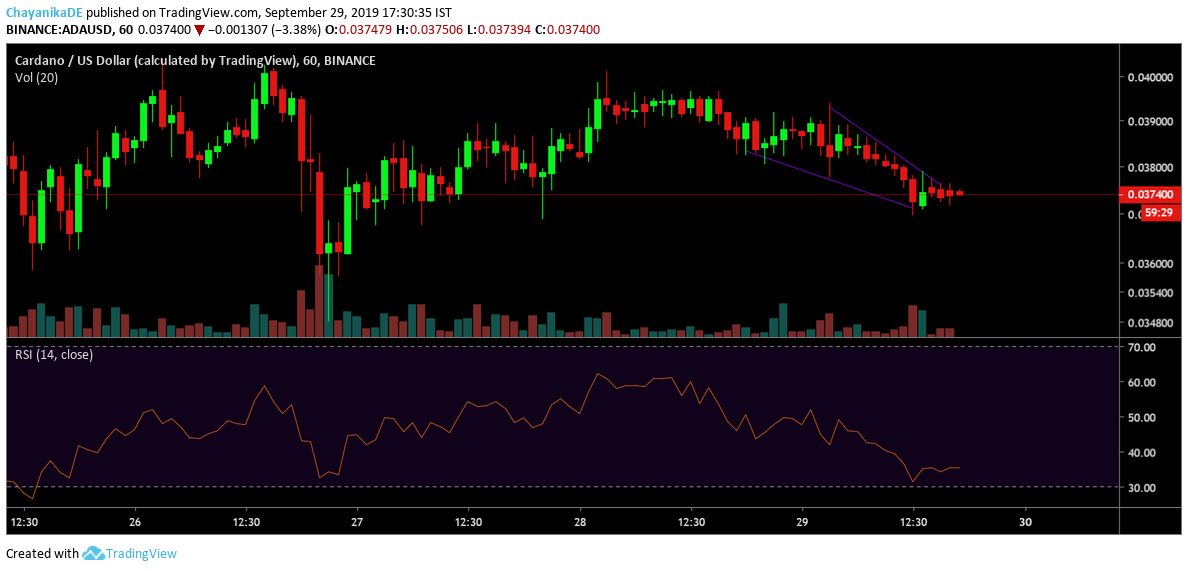
Source: TradingView
The hourly chart for Cardano projected formation of falling wedge pattern. The price followed two down-sloping and converging trendlines. This was indicative of a potential price rise in the near-term following closure of the pattern. A high buying rate was noted in the first part of September 28th. RSI indicator fell deeper soon after and was resting below median line of 50 as of September 2019. This suggested a high sell rate for the altcoin and a bearish sentiment among buyers.
Cardano [ADA] 4-hour Chart:

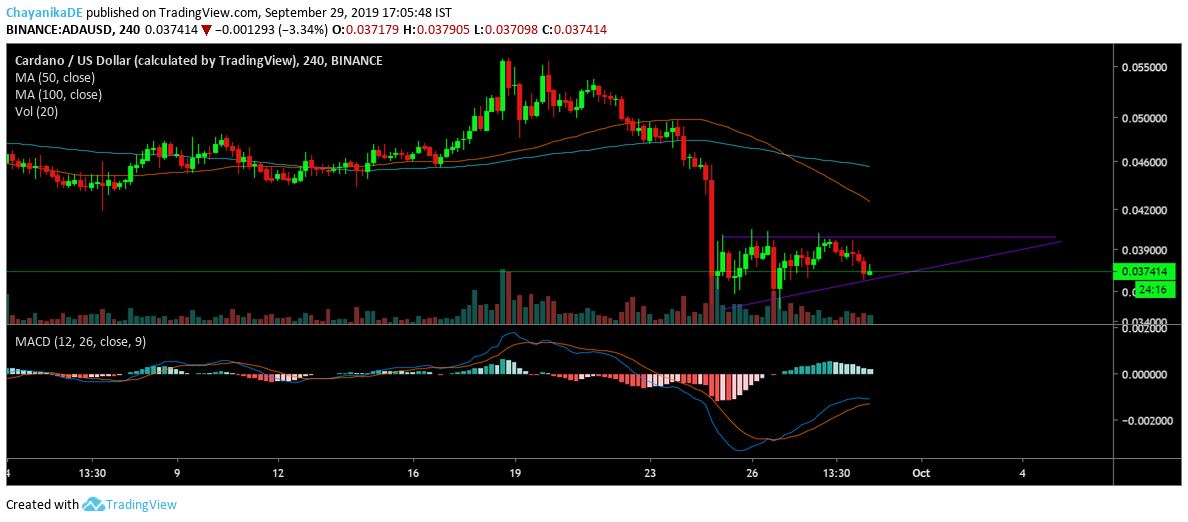
Source: TradingView
Four-hour chart for ADA depicted formation of an ascending triangle with the price pattern bounded by a horizontal and an upward sloping trendline. A potential bullish trend was predicted following completion of the triangle. Higher highs for the pattern registered at $0.038, $0.039 and $0.0391. Additionally, strong support was found at $0.036. The reading line in the MACD indicator was above the signal line and further projected a bullish trend for the coin.
As the price consolidated within the ascending triangle, ADA’s volume showed signs of a decline, hinting at a price breakout in the near-term. Following the recent downtrend, 50 moving average for ADA was below 100 moving average, depicting a bearish phase for the coin.
Conclusion:
Cardano could potentially head for an upward price breakout despite high selling pressure. This would mean breaking the previously set resistances above the crucial $0.040 mark.