Cash Cat drops 15% – Can the memecoin’s $0.087 support survive?
Previous rebounds began here, but current outflows raise a harder question: Who remains willing to buy?



Cash Cat [CASHCAT] declined 15% over the past day as selling pressure overwhelmed market demand.
The decline followed the direction AMBCrypto reported earlier, when CASHCAT found support at the Lower Bollinger Band.
The report noted that a relief rally remained possible. However, unchanged market conditions could prevent a sustained recovery.
At present, the Perpetual Market continued recording heavy Capital Outflows.
Long liquidations were 397 times higher than short liquidations, compared with the previously reported 490-fold gap. The gap narrowed but remained heavily skewed against bullish positions.
The question is whether a repeatedly tested Demand Zone can outweigh continued derivatives weakness.
Can CASHCAT’s demand zone hold?
Chart analysis showed CASHCAT trading inside a critical Demand Zone between $0.093 and $0.087. This range triggered a rally on four previous occasions.
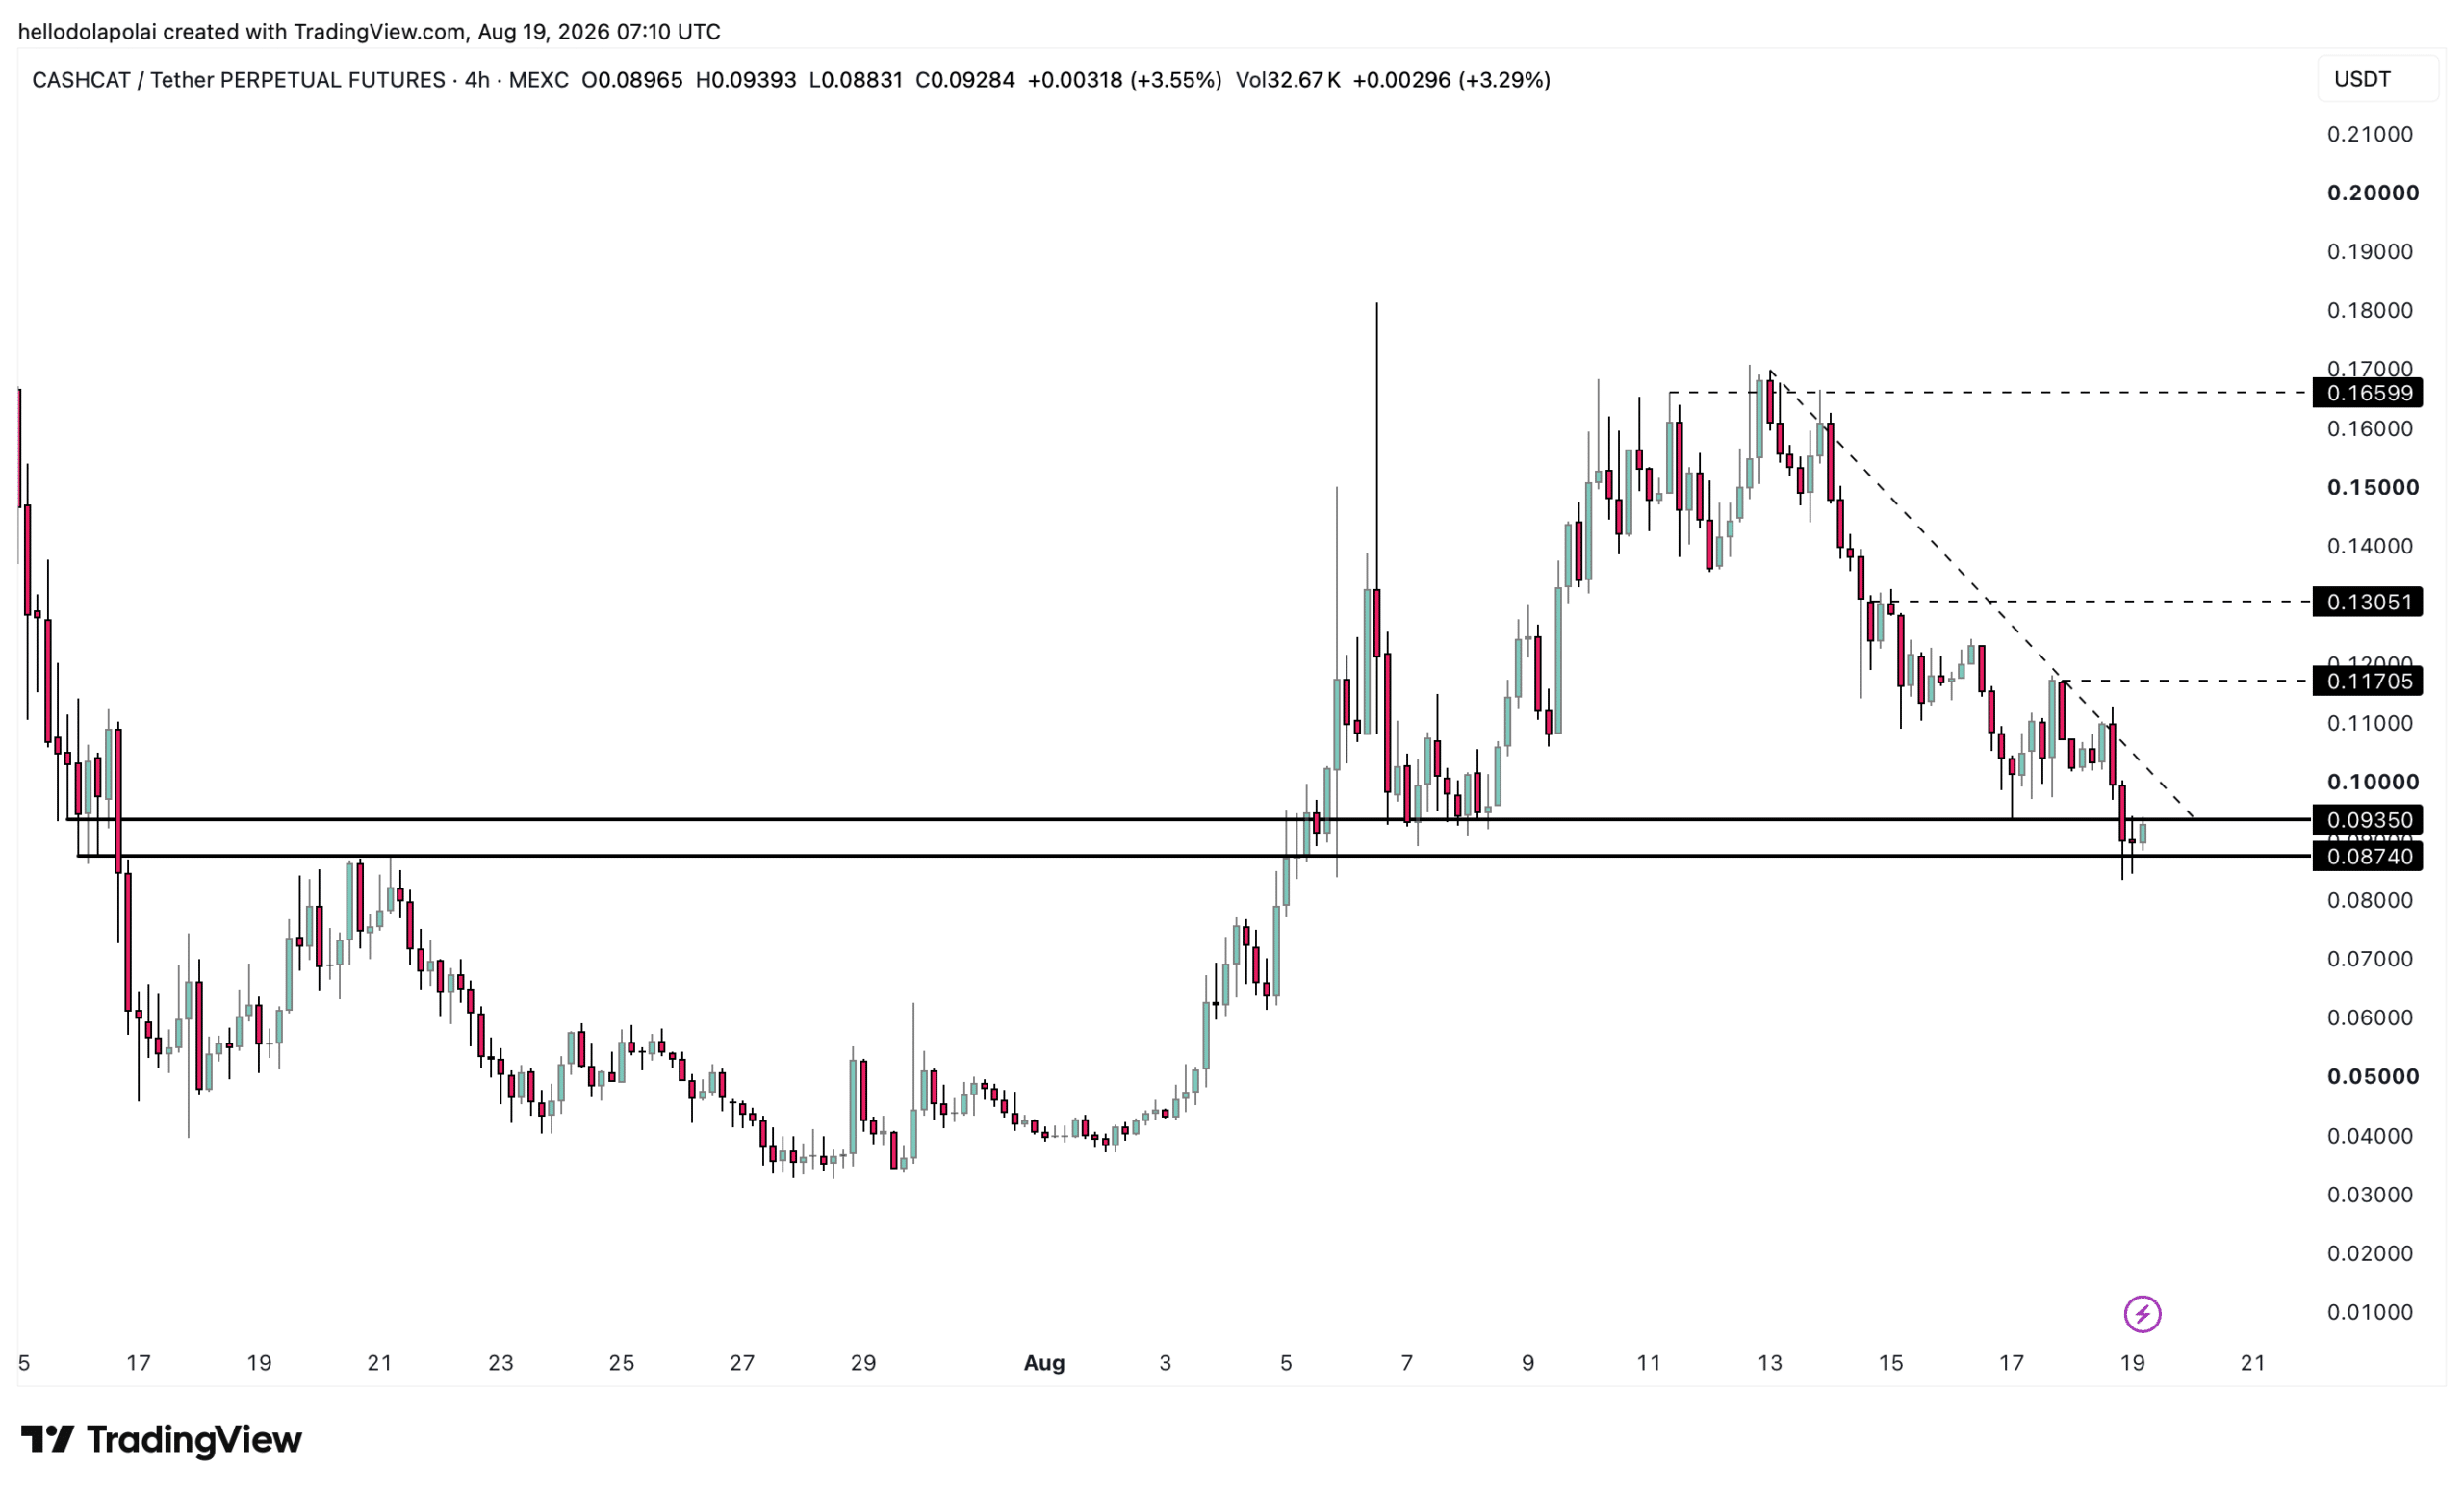
Another bullish reaction would require CASHCAT to reclaim the upper boundary at $0.093.
If demand remains insufficient, the price could continue ranging inside the zone or break below $0.087. Continued seller dominance could then expose CASHCAT to further losses.
Do CASHCAT indicators signal more losses?
The Aroon Indicator and Parabolic SAR showed that CASHCAT remained in a bearish phase.
Aroon Down stood at 85%, above the Aroon Up reading of 35%. These readings favored sellers, although the gap remained below an extreme 100-to-0 split.
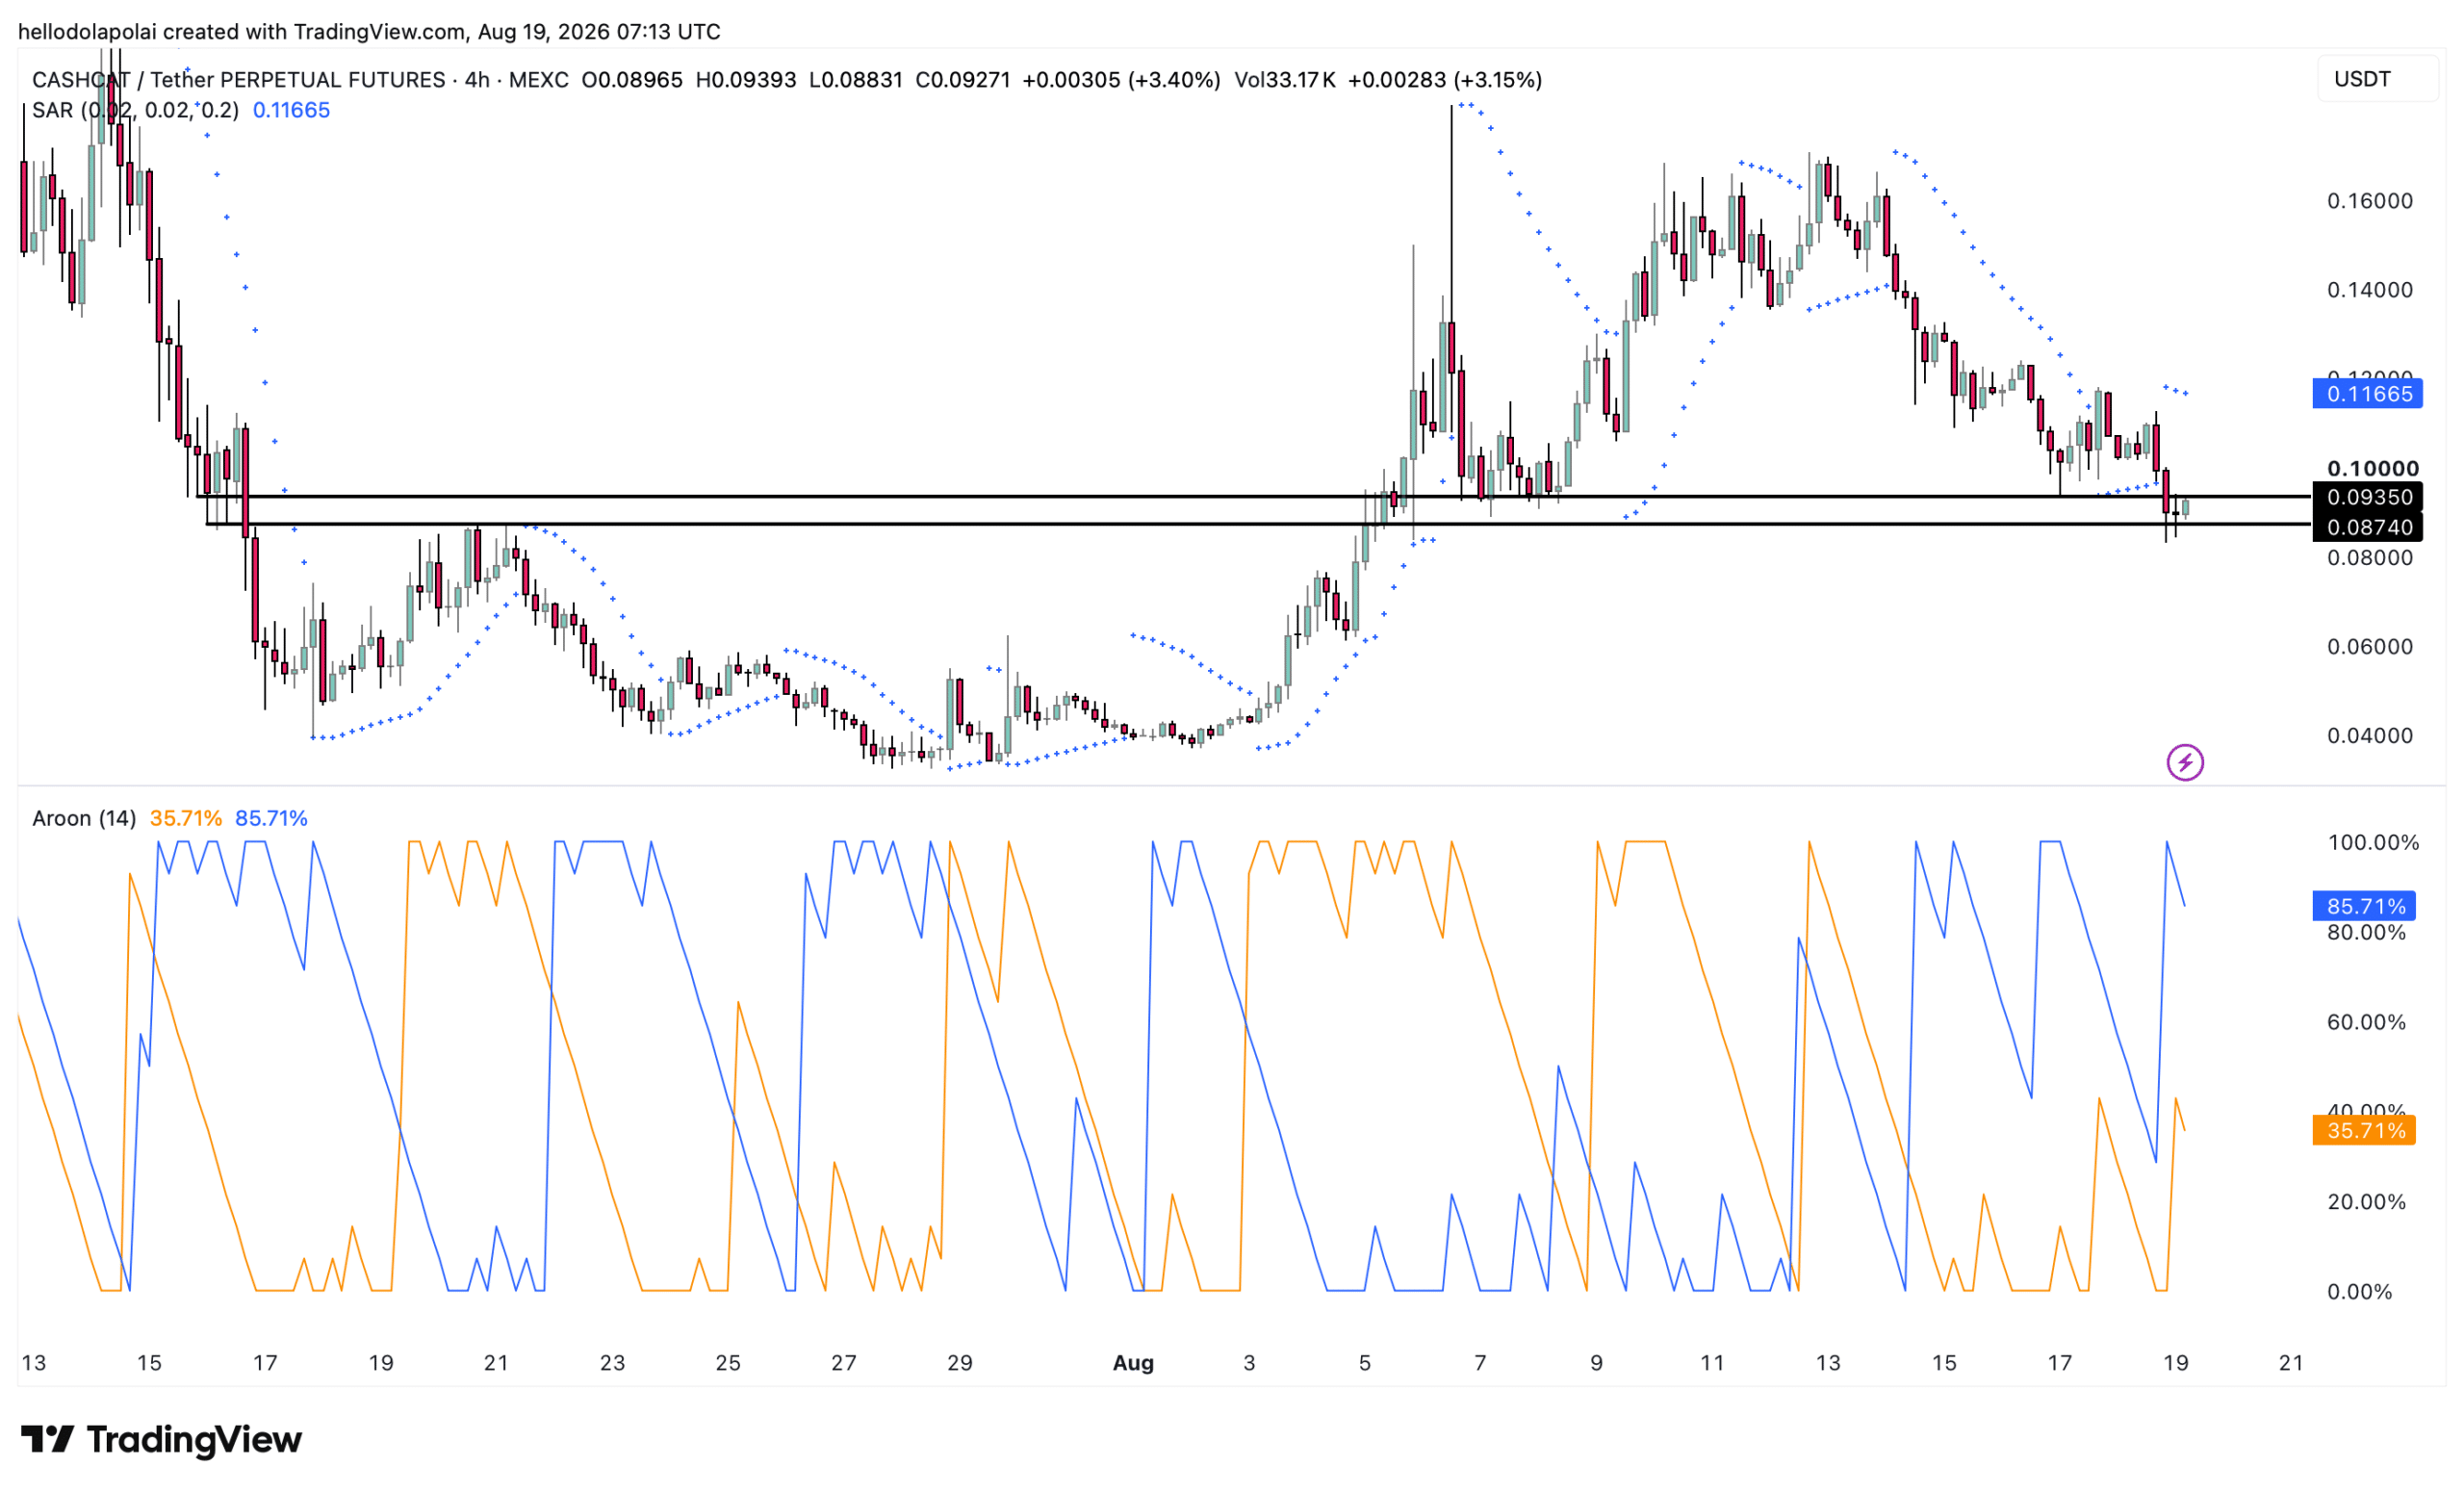
Even so, the Parabolic SAR dots remained above price, showing that selling momentum persisted. This structure suggested continued downside pressure while CASHCAT struggled to reclaim $0.093.
Without stronger demand, the price could retest the Demand Zone’s lower boundary.
Why is CASHCAT demand still weak?
CoinGlass data showed that CASHCAT’s Perpetual Market continued recording Capital Outflows. Perpetual Netflow showed that $293,100 had left the market.
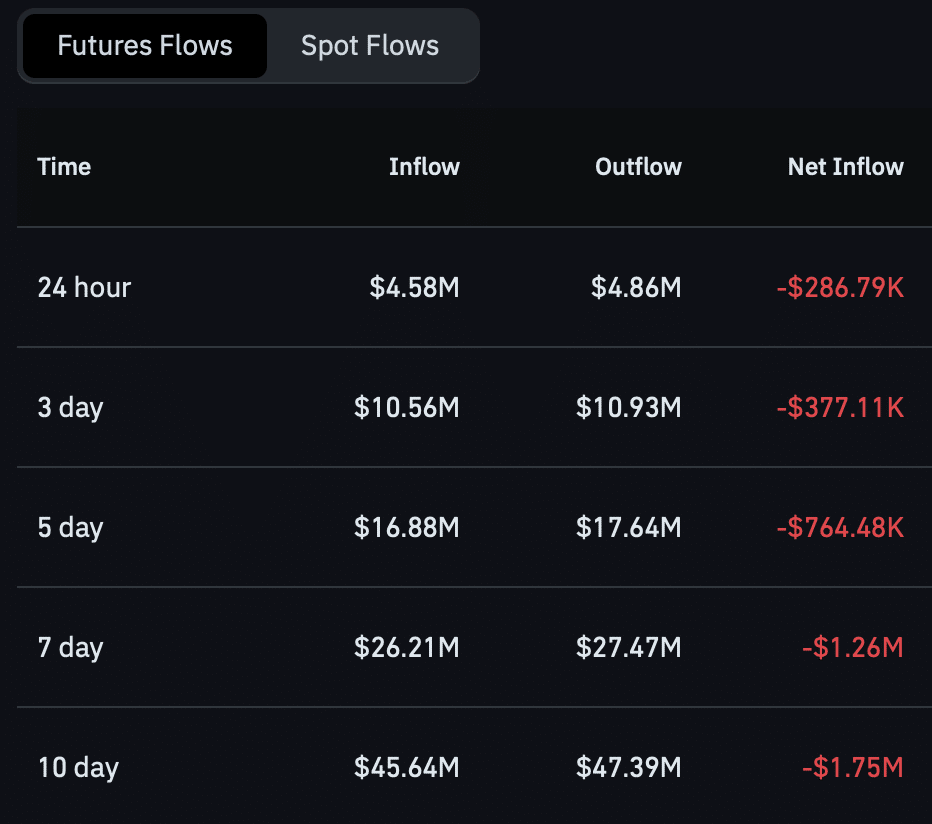
That amount represented more than 38% of the $764,880 Net Outflow recorded over seven days. The persistent imbalance suggested that equivalent demand had yet to return.
Previous rebounds began inside the current zone, but the present setup carries weaker derivatives support. This leaves leveraged longs exposed if CASHCAT loses $0.087.
Final Summary
- CASHCAT returned to a Demand Zone that previously triggered four separate rallies.
- Capital Outflows and bearish indicators could expose CASHCAT to further losses below $0.087.