Celestia price prediction: Why TIA’s bounce above $0.40 may invite profit‑taking
The Celestia bounce and volume spike in the past 24 hours should not be taken as an encouragement to buy.

Celestia [TIA] was one of the handful of tokens in the crypto market that posted noticeable gains in the past 24 hours. The altcoin was up 5.2% with a 30% increase in trading volume, but its long-term trend was not bullish.
As we shall explore soon, the token has been in a higher timeframe downtrend since April 2024. Any rally, even sizeable ones, has only operated within this downtrend and served as a relief rally.
Steady token unlocks and a shift in narrative towards AI and RWAs, as well as a lack of sustainable adoption, were likely the biggest reasons why Celestia was undergoing a prolonged downturn.
Though the Open Interest boost of 11.3% in 24 hours indicated speculative inflows, the wider market pessimism is likely to send TIA lower once more.
The TIA downtrend and consolidation in 2026
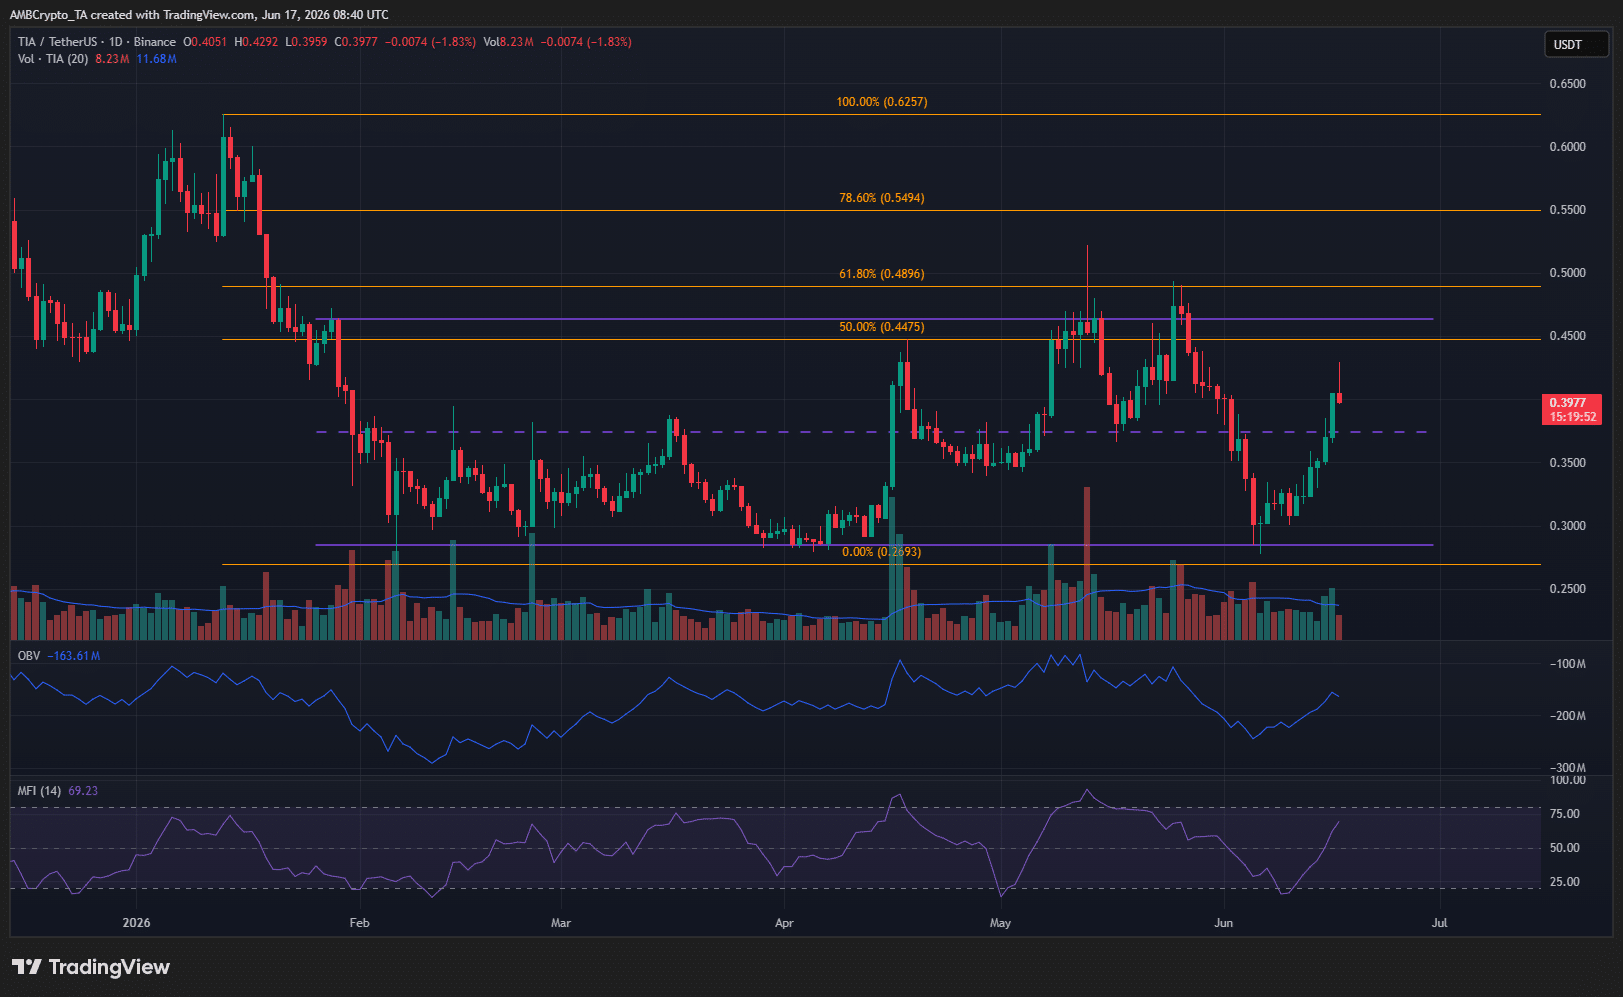
The Fibonacci retracement levels (orange) captured the swing structure on the 1-day timeframe. The altcoin set a swing low at $0.429 in December 2025, bounced to $0.625, then careened to $0.269 by early February 2026.
This bearish impulse move broke the previous swing low, marking $0.625 as the high that the buyers need to reclaim to establish a bullish structure.
This might not happen anytime soon. The OBV has been in decline since May, and TIA has twice faced rejection from the 61.8% retracement level at $0.489.
Since February, the altcoin has also formed a range between $0.284 and $0.463. This meant that the $0.45-$0.50 was a key overhead supply zone, alongside the $0.549 retracement level.
TIA traders would be looking to sell this bounce
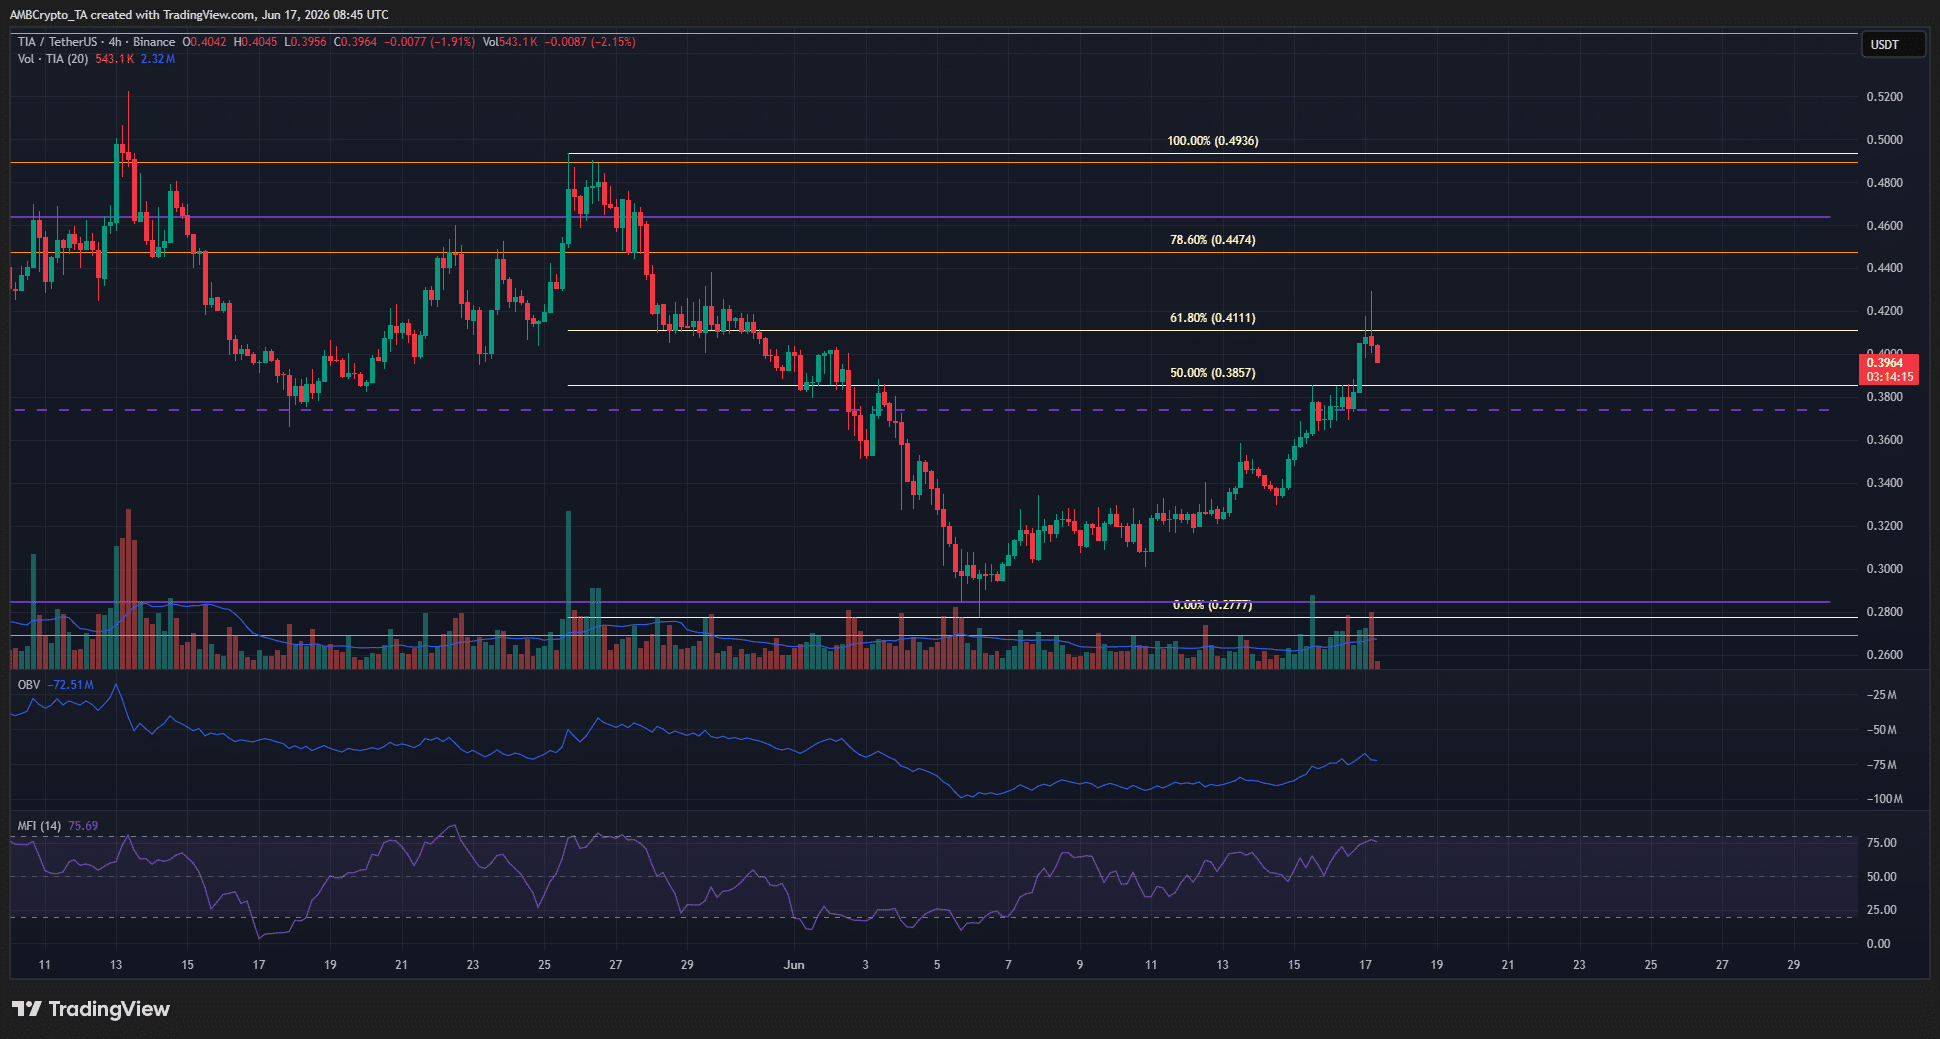
Using a similar analysis on the 4-hour chart, the bearish swing structure was used to plot retracement levels. The recent bounce reached the $0.411 level before facing rejection, and was falling lower at press time.
Though the MFI climbed to 75, the trend favored the sellers. Traders can look to short Celestia, especially if Bitcoin continues its descent below the $65k level.
Even a move up to the golden pocket between $0.411 and $0.447 would still be part of a seller-controlled market. A breakout past $0.625 is needed to escape the long-term bears’ clutches.
Final Summary
- Celestia’s bounce and volume spike in the past 24 hours should not be taken as an encouragement to buy.
- The 4-hour chart showed a downtrend in progress, and TIA’s jump to $0.411 presented a selling opportunity.