- TIA is one of the highest gainers in the last 24 hours.
- Celestia saw an increase of over 120% in volume.
Celestia [TIA] is currently positioned between the 60th and 62nd spots in the market capitalization ranking. However, its recent performance has been particularly noteworthy as it has emerged among the top gainers over the last 24 hours.
This rise in ranking highlights a surge in investor interest and market activity surrounding TIA.
Celestia sees consecutive uptrends
Celestia has recently shown an encouraging trend on its daily time frame chart, as noted in AMBCrypto’s analysis.
The asset experienced a significant increase of 11.52% at the close of trading on 21st July, with its price rising from around $6.5 to approximately $7.2.
This increase marked a reversal following three days of consecutive declines and represents the third day of positive trends for Celestia.
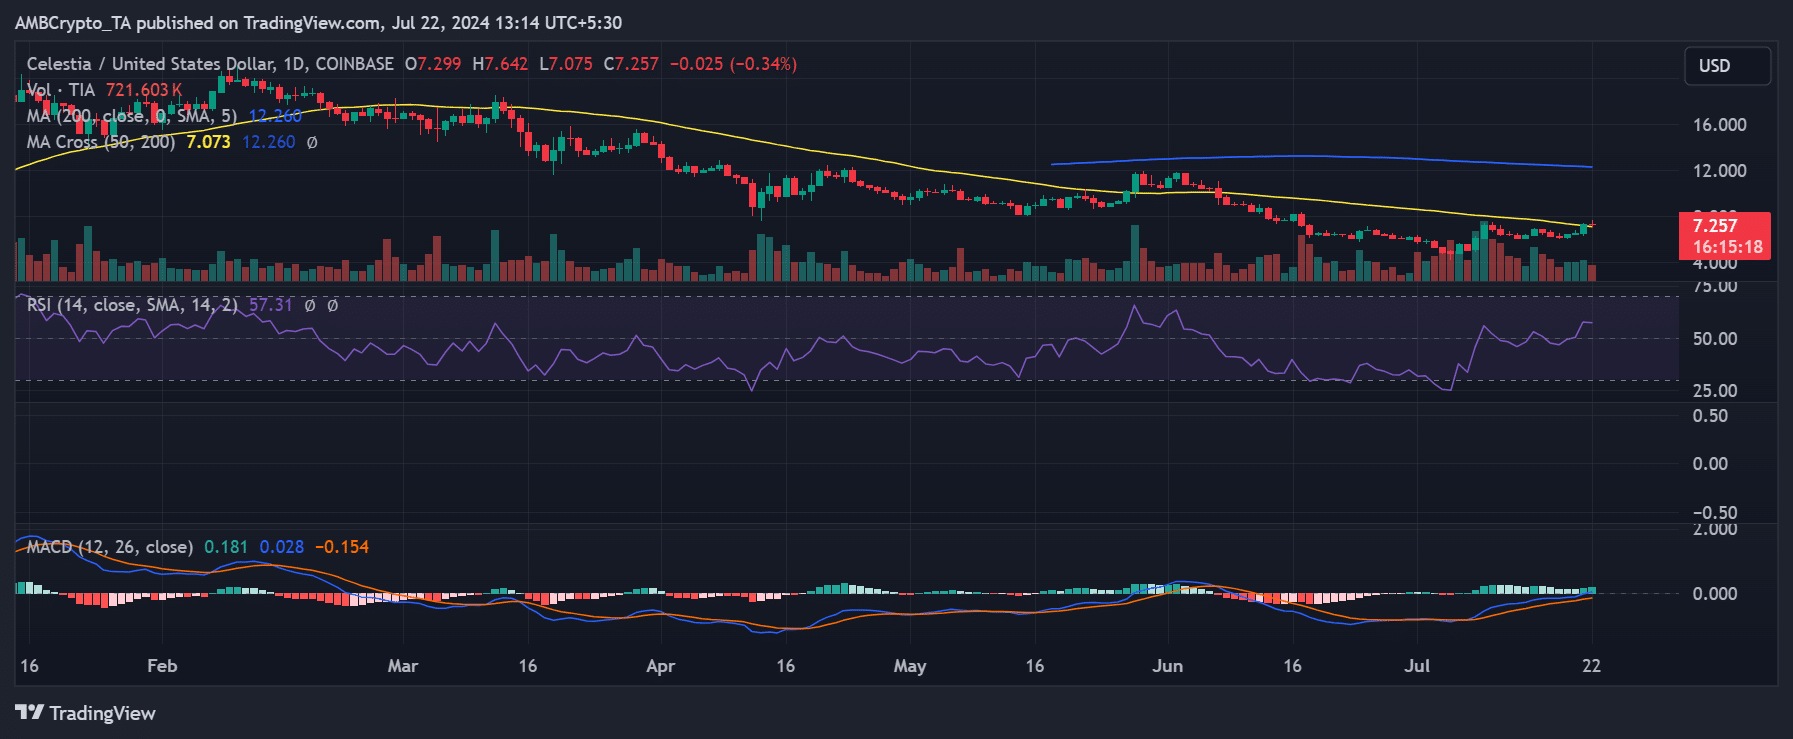
Source: TradingView
Currently, while the price is maintaining the $7.2 range, it is struggling to sustain the initial momentum. This observation suggests a phase of consolidation or possible hesitance among traders to push the price higher without further catalysts.
Additionally, the analysis of Celestia’s Moving Average Convergence Divergence (MACD), a trend-following momentum indicator, shows positive signs but indicates that the MACD lines have not yet crossed above the zero line.
Volume activity rises
Celestia has demonstrated impressive performance on the 24-hour gainers’ chart, according to CoinMarketCap. The chart showed it was oscillating between the first and second positions.
Currently, it has achieved an 11% gain in the last 24 hours, a rise that is mirrored in its market capitalization, which now exceeds $1.4 billion, also up by over 11%.
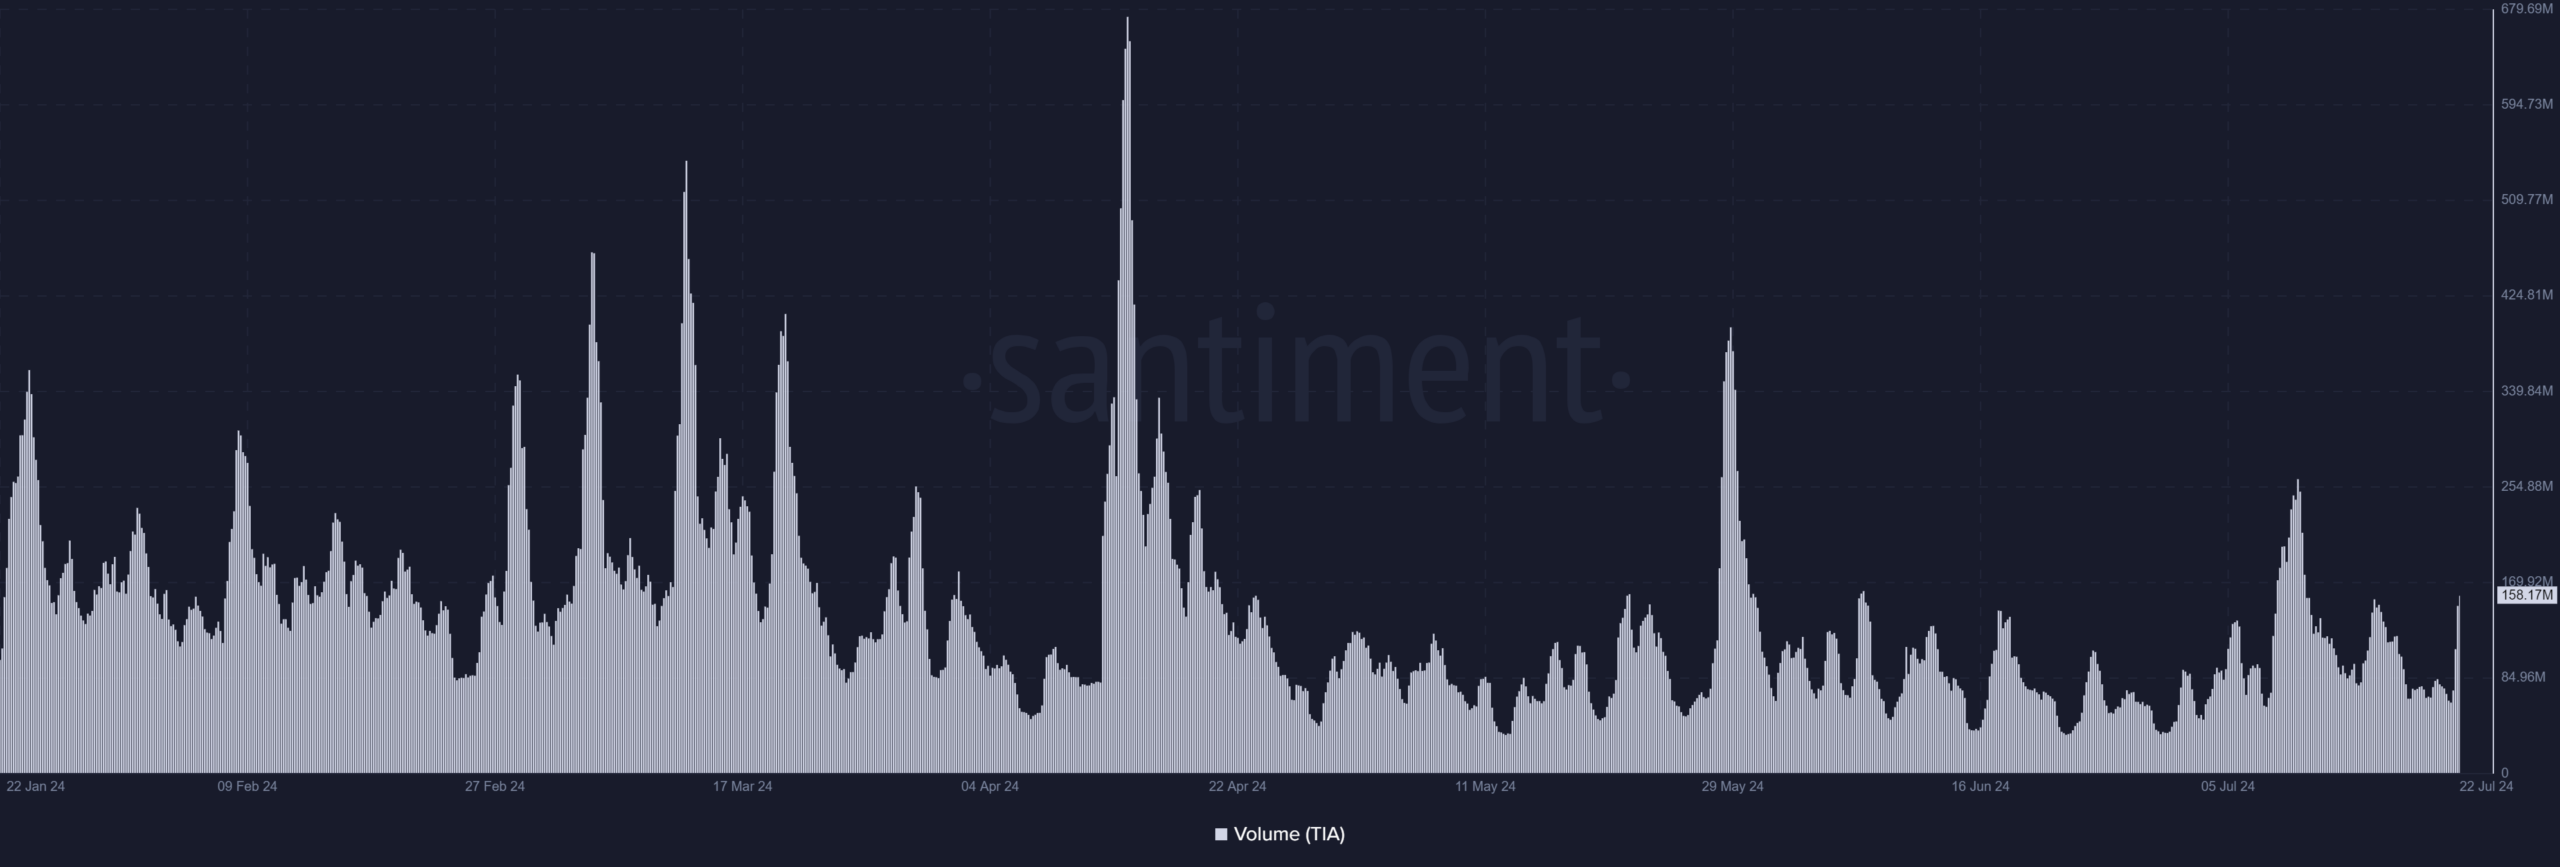
Source: Santiment
The trading volume for Celestia showed even more pronounced growth. Data showed it surged by more than 120% in the last 24 hours, reaching over $159 million.
However, analysis of the volume on Santiment highlights that while there has been a noticeable spike in volume, it is not the highest seen in the month.
Where next for TIA?
The uptrend in Celestia’s trading volume alongside its price suggests a convergence. It indicates that the increase in trading activity is supporting the current price movement.
This synchronization often signals a healthy market reaction where price changes are backed by substantial trading volumes, providing a solid foundation for the observed price trend.
However, the current market dynamics for Celestia indicate a pivotal moment, as there is an ongoing tug-of-war between buyers and sellers.
Realistic or not, here’s TIA market cap in BTC’s terms
This struggle is a critical factor in determining the future direction of Celestia’s price.
If buyers gain the upper hand, it could lead to a sustained upward movement as demand outstrips supply. On the other hand, if sellers prevail, the increased selling pressure could cause the price to retract.