Chainlink: 62% of holders ‘in the money’ as LINK hits 6-week high
LINK remains at risk of decline as the current buying pressure is not strong enough to sustain the ongoing rally.

- LINK has climbed to its highest price level in six weeks.
- Most LINK transactions continue to return profit.
Chainlink [LINK] leads the altcoin rally following its price rise to a six-week high, data from Santiment has shown.
According to the on-chain data provider, during the intraday trading session on 23rd May, the altcoin briefly exchanged hands at $17.53 before witnessing a slight retraction. A
s of this writing, LINK exchanged hands at $17, according to CoinMarketCap’s data.
LINK holders in gains
The recent surge in LINK’s price has caused it to be a significantly profitable investment for its holders.
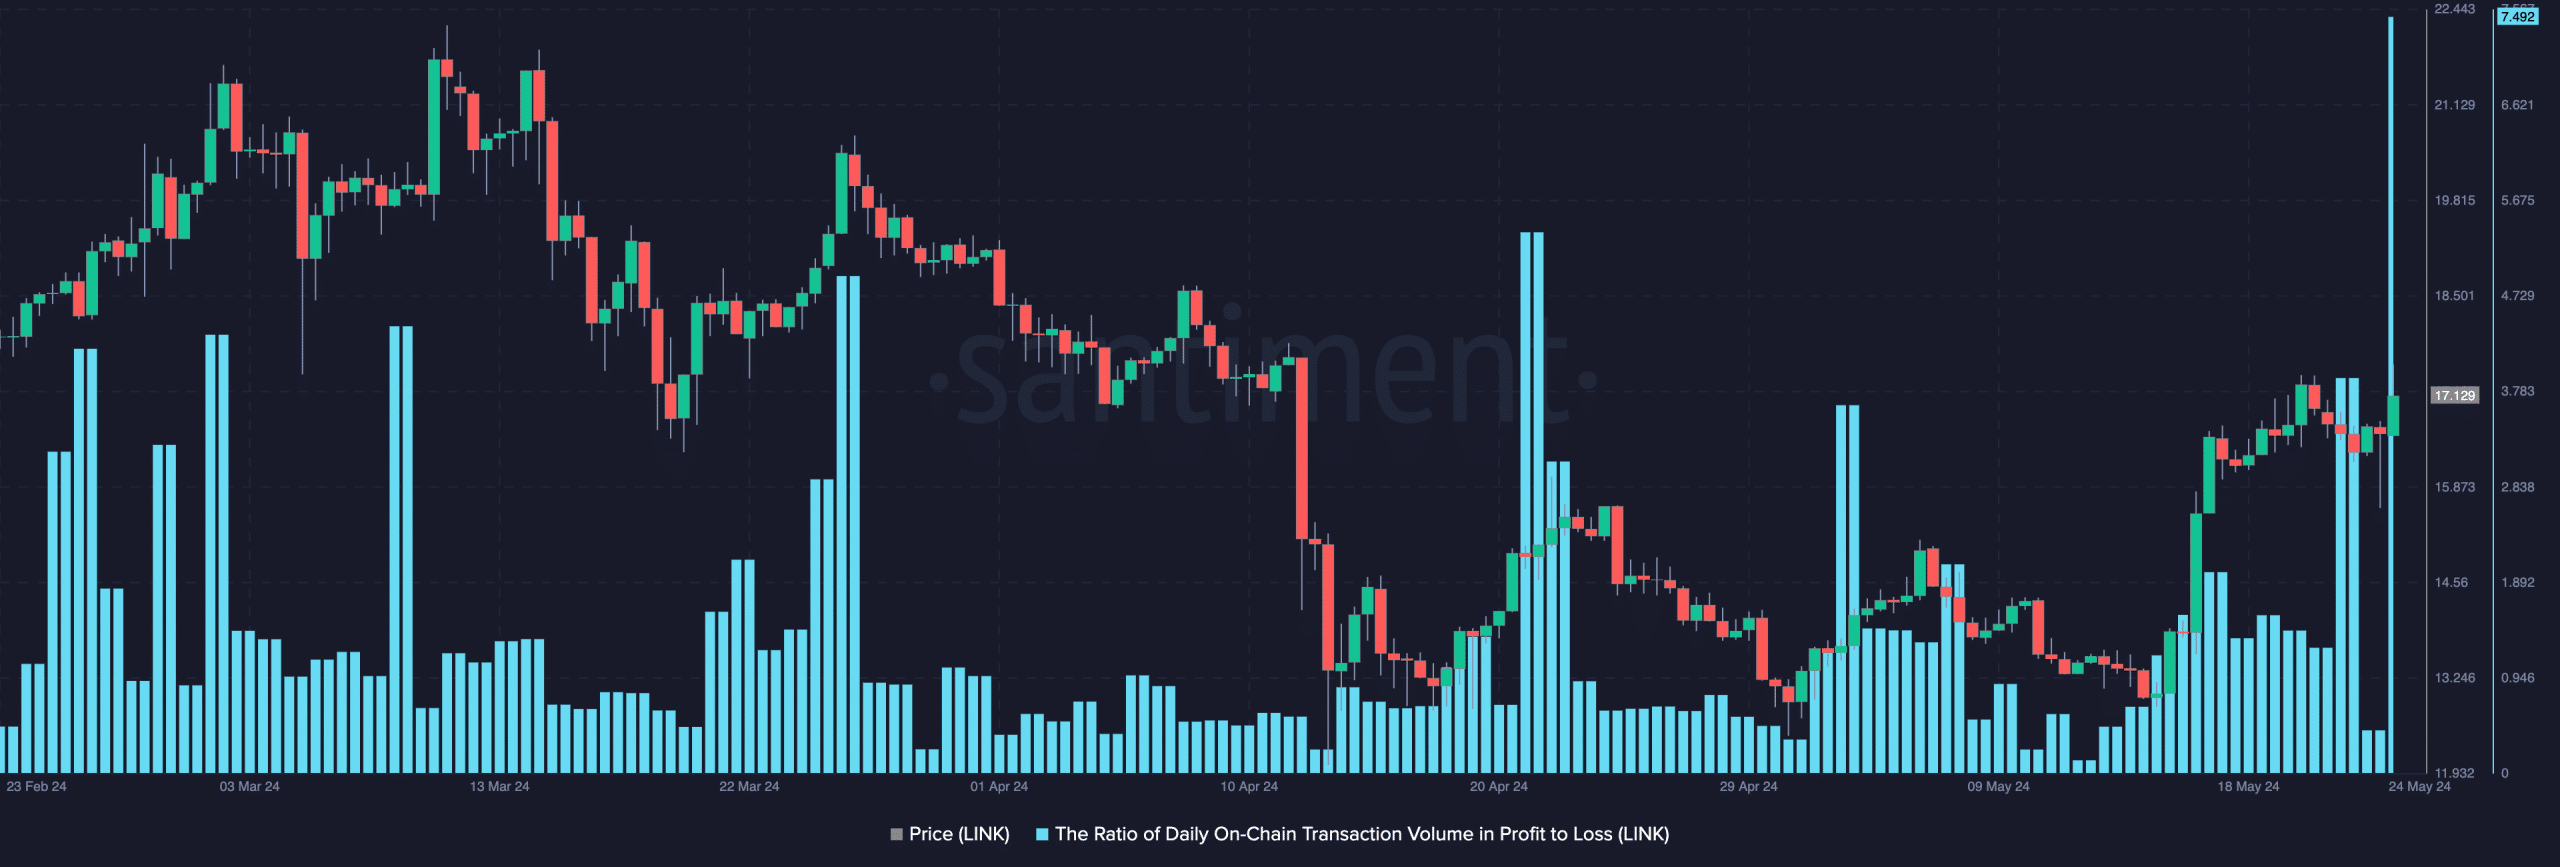
AMBCrypto assessed the ratio of LINK’s daily transaction volume in profit to loss and found that it was 11 on 23rd May. This signaled that for every LINK transaction that ended in a loss during that trading period, 11 transactions returned a profit.
As of this writing, this metric’s value was 7.49, suggesting that profitable transactions remained high.
Further, the token’s Market Value to Realized Value (MVRV) ratio was 71.56%. This suggested that LINK’s market price was significantly higher than the average acquisition price across all holders.
Although it signaled that the token was overvalued, it also meant that LINK holders were assured a profit if they sold.
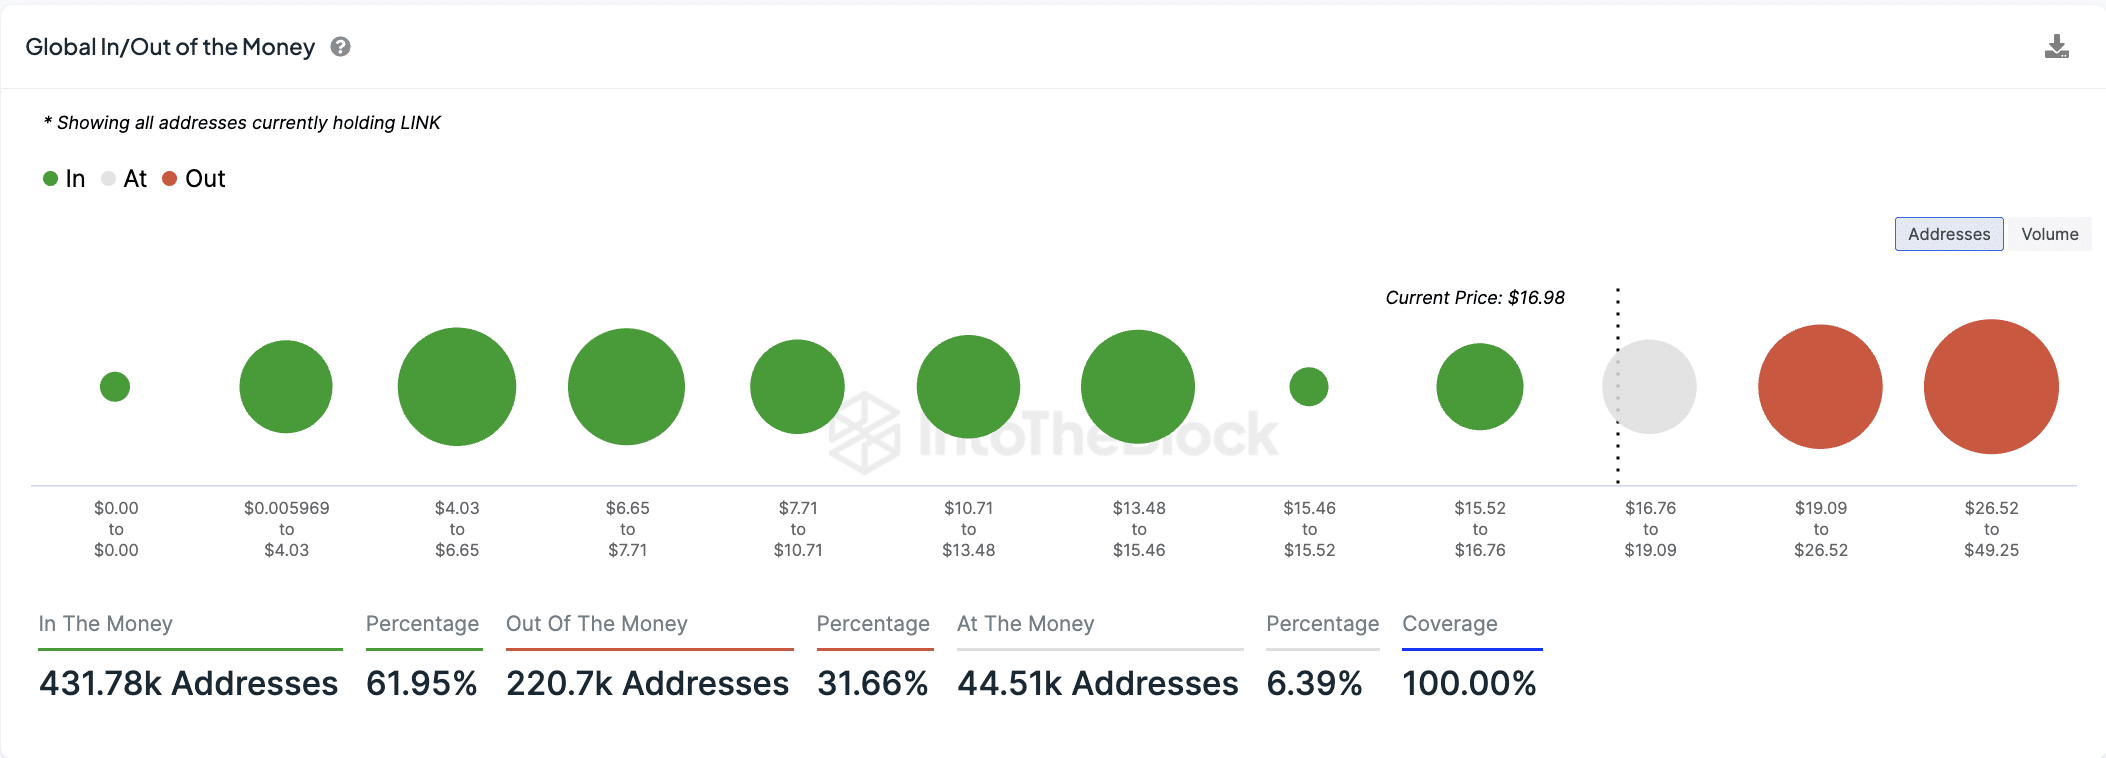
Currently, 432,000 wallet addresses, which make up 62% of all LINK holders, are “in the money,” according to IntoTheBlock. These are investors who hold the altcoin at a profit.
Conversely, 221,000 addresses, representing 32% of all LINK holders, are “out of the money,” holding their tokens at a loss.
Do not get carried away
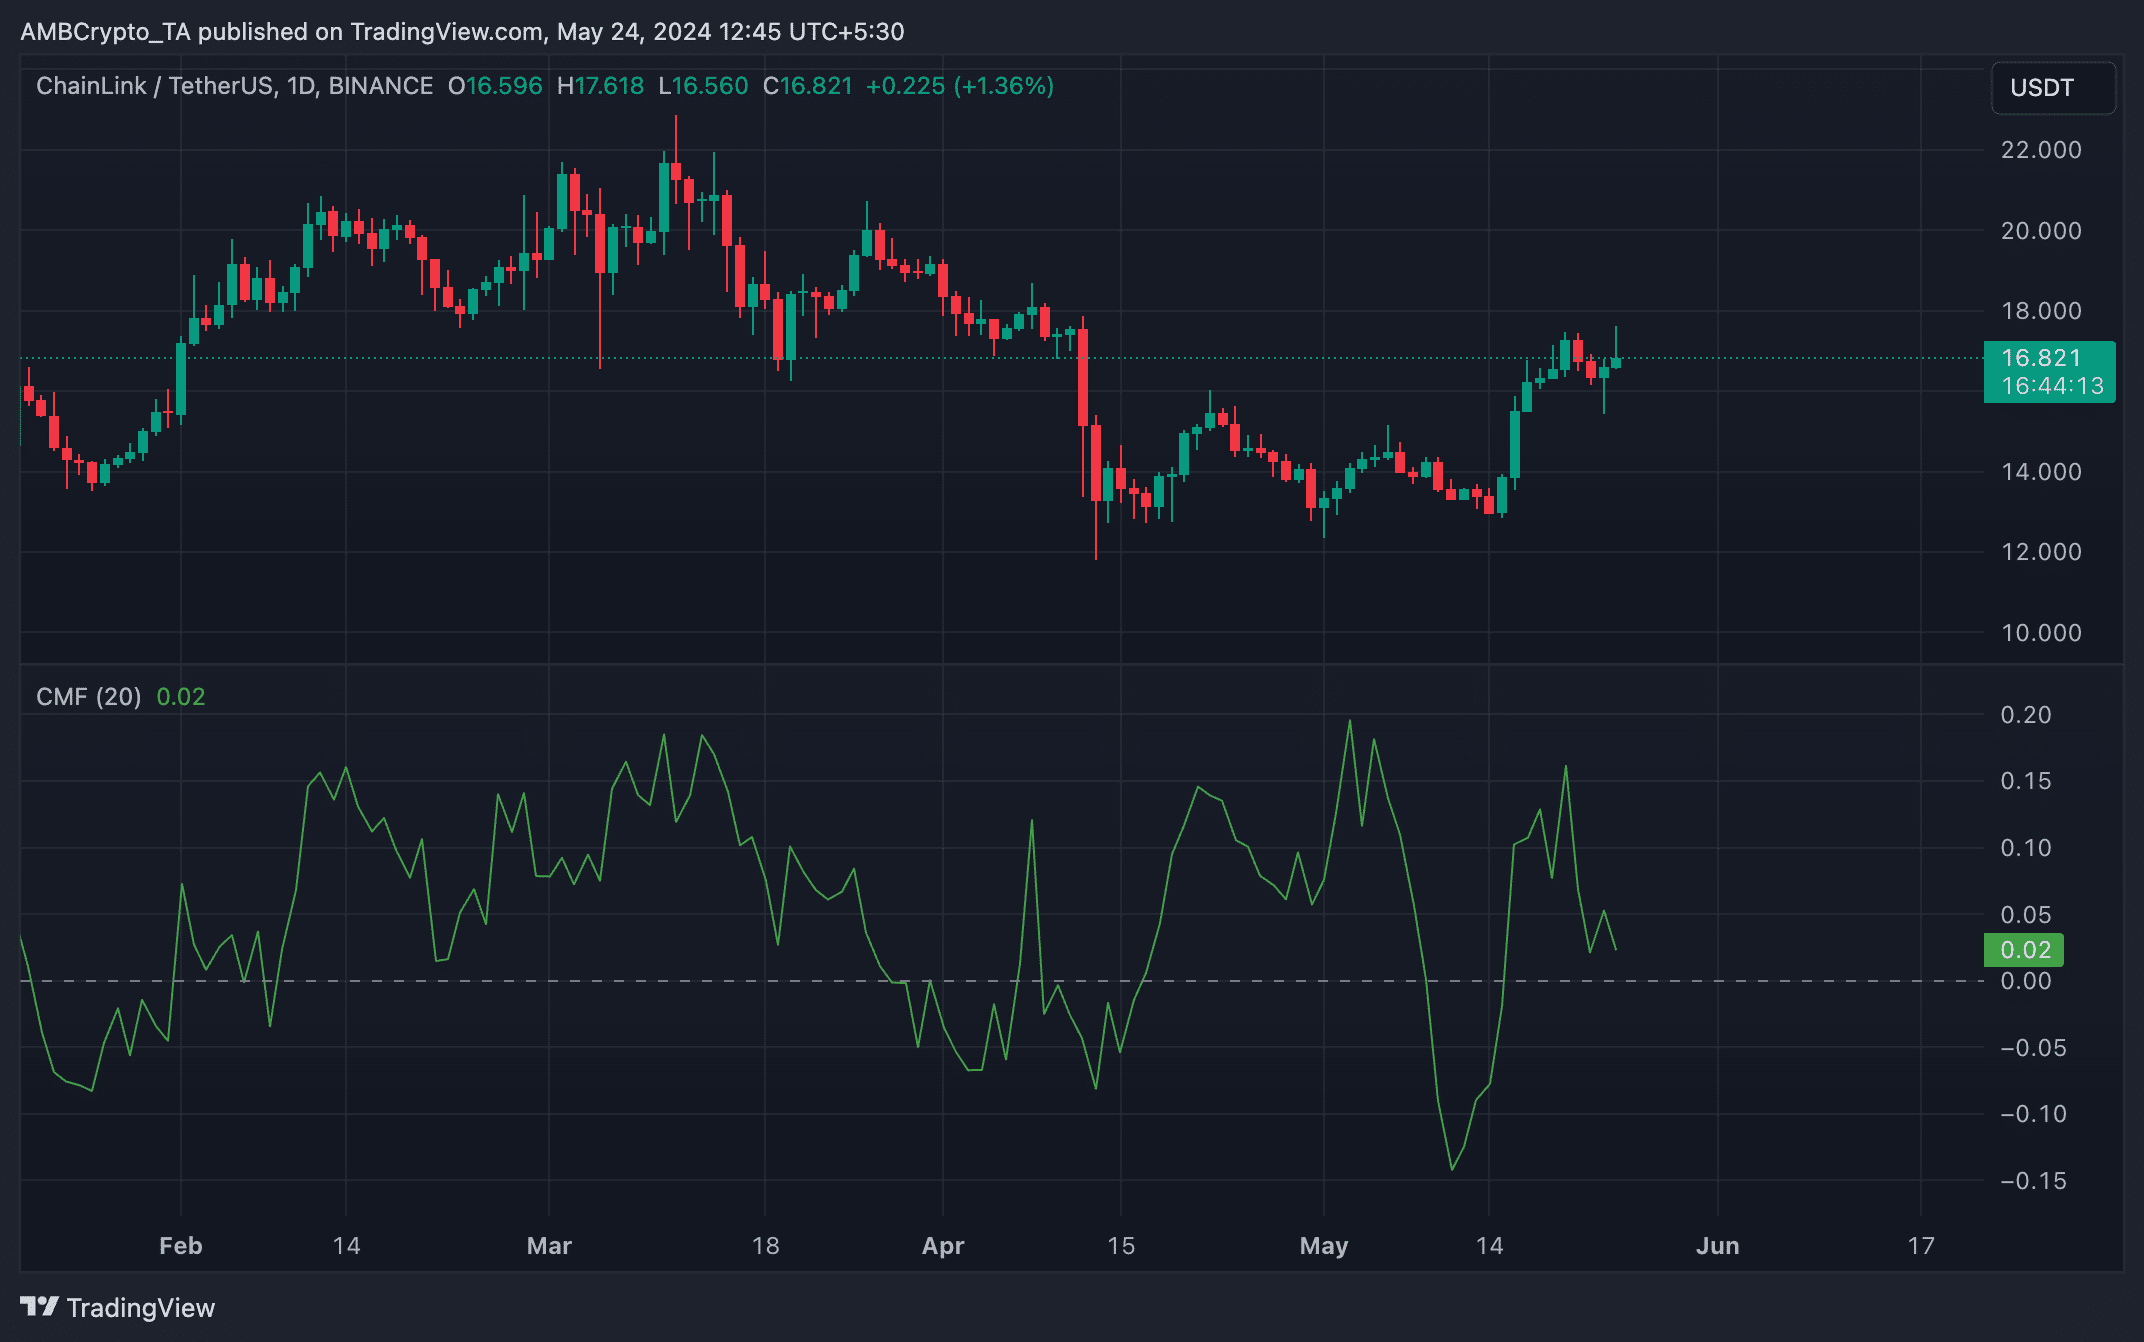
Despite LINK’s price rally in the last week, a key technical indicator has trended downward, forming a bearish divergence.
Readings from LINK’s daily chart revealed that its Chaikin Money Flow (CMF) declined even as its price surged over the past seven days. This indicator measures money flowing into and out of LINK’s market. At press time, LINK’s CMF was near nits zero line at 0.02.
Is your portfolio green? Check out the LINK Profit Calculator
A bearish divergence is formed when an asset’s price rallies while its CMF trends downward. This means the buying volume is not as strong as expected even though the asset’s price is increasing.
It suggests to market participants that the price rally may not be sustainable.


