Chainlink, AAVE, Enjin Coin Price Analysis: 3 November

The global crypto market cap witnessed a nearly 3% surge as the market dominators were in the green. Consequently, Chainlink displayed a bullish price action and preferred buyers in the near term.
However, tokens like AAVE and Enjin Coin indicated near-term signs of easing bullish momentum.
Chainlink (LINK)
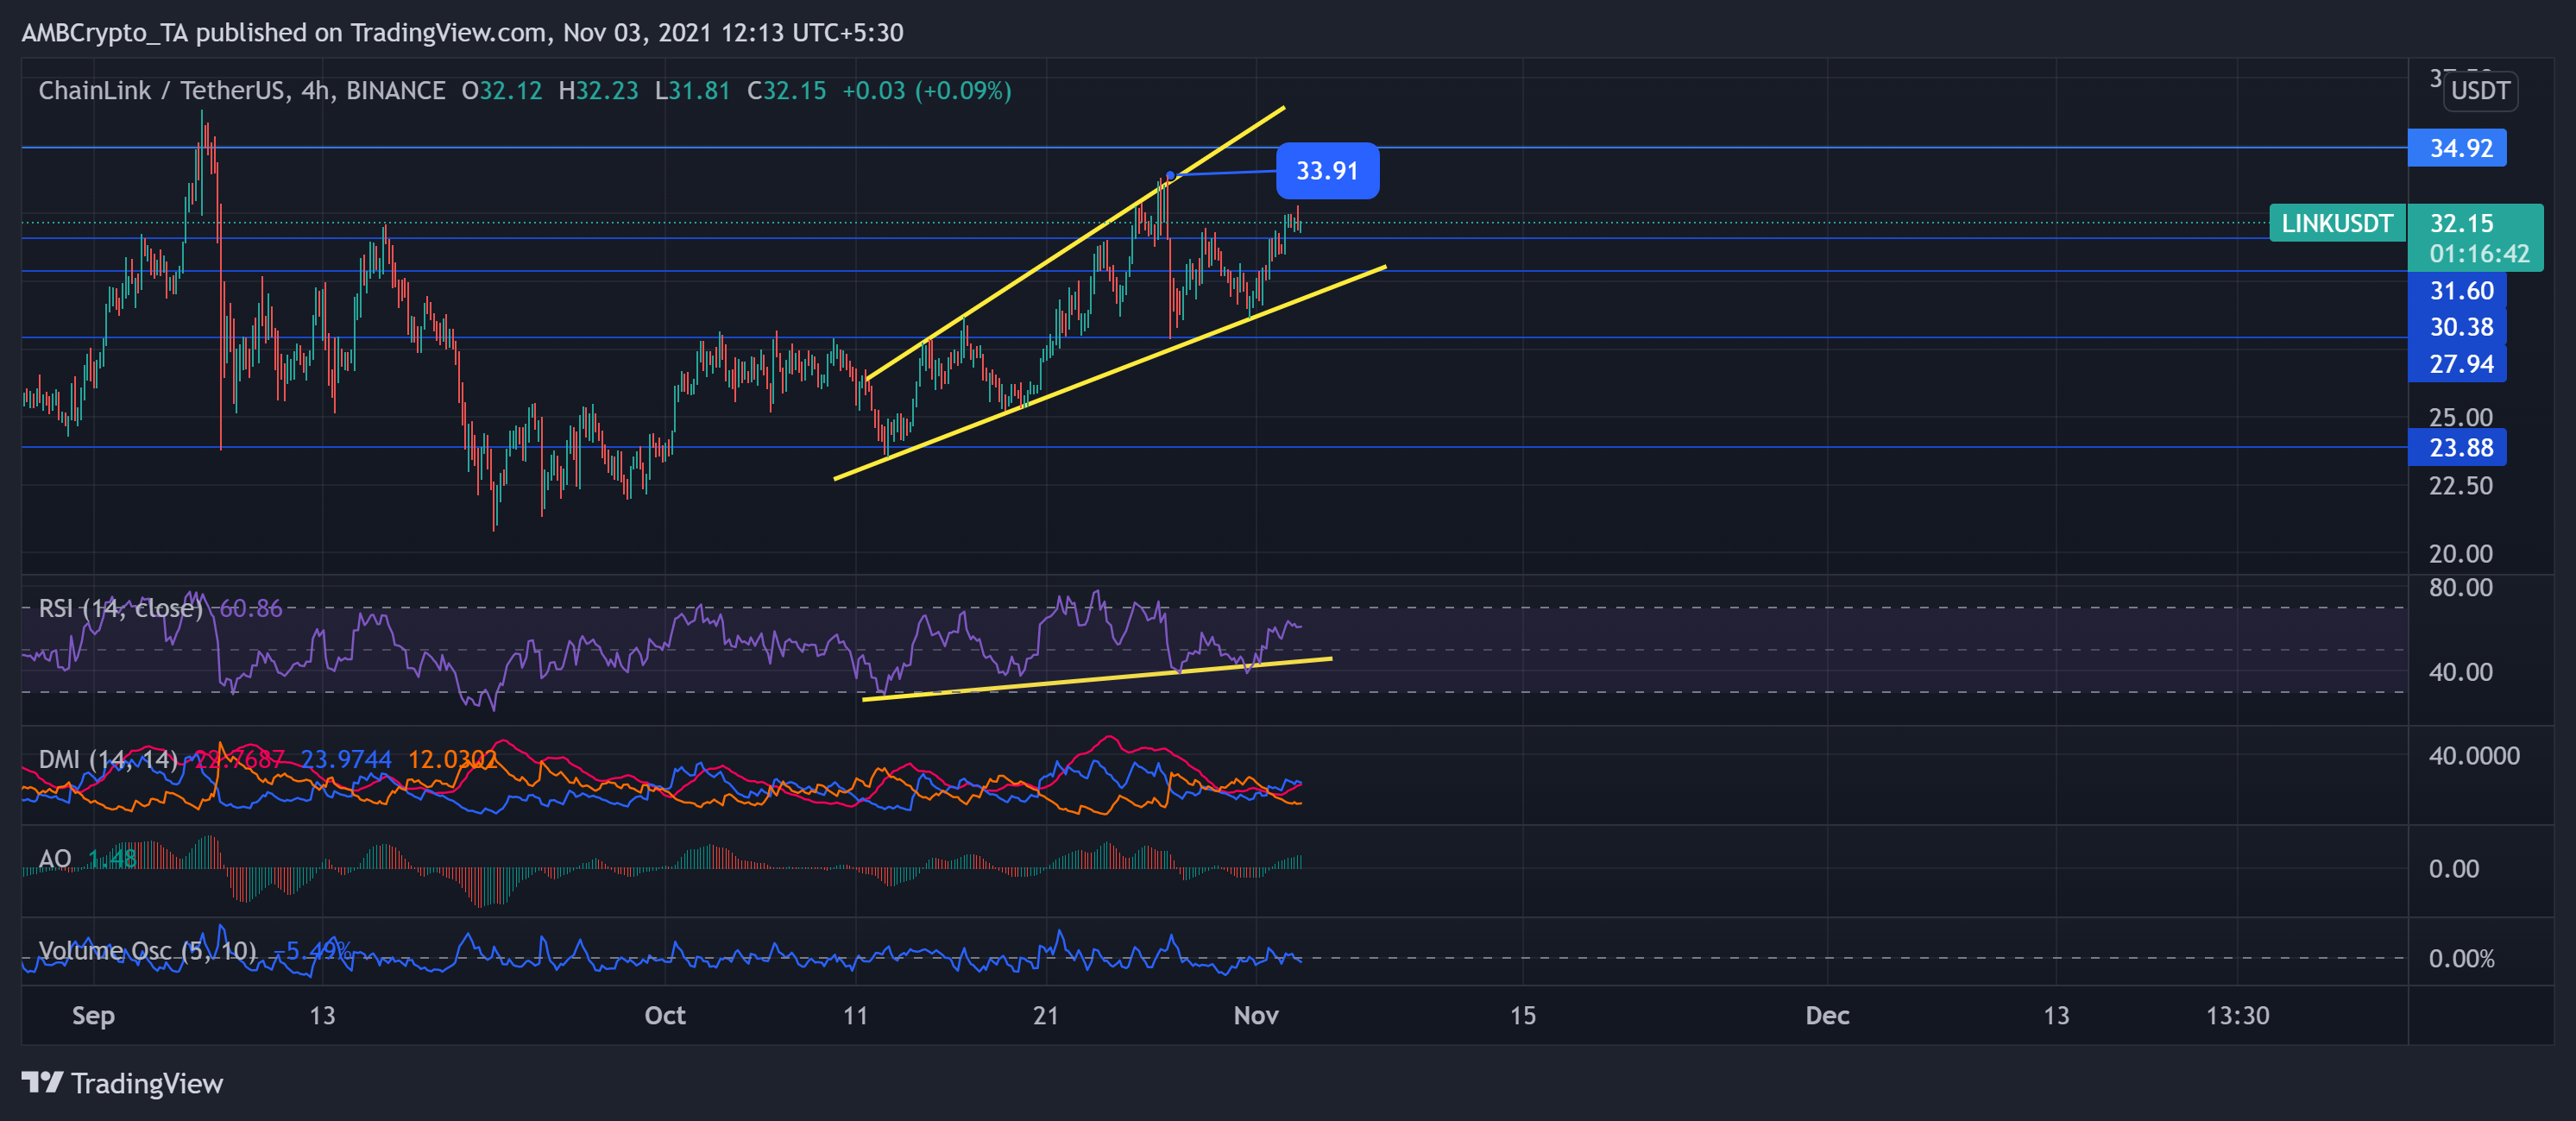
For the past 22 days, LINK noted higher highs and higher lows after assuming a steady uptrend. The digital currency registered a 20.27% monthly ROI. Consequently, LINK reached its seven-week high on 27 October at $33.91 and rebounded between the trendlines. After which, within a few hours, the alt hit its week’s low as the bears exerted sustained pressure.
However, the bulls displayed vigor as the price gradually breached its immediate support at $31.60 and noted a 10.75% weekly ROI. At press time, LINK traded at $32.15.
Also, near-term technicals showed a preference for buying strength as the Relative Strength Index (RSI) stood at the 60-mark. Additionally, the DMI lines depicted a momentum in favor of buyers, and the Awesome Oscillator (AO) revealed green signals.
However, the trading volumes fell marginally, and the ADX line was at the 22-mark, hinting at a slightly weak directional trend.
AAVE
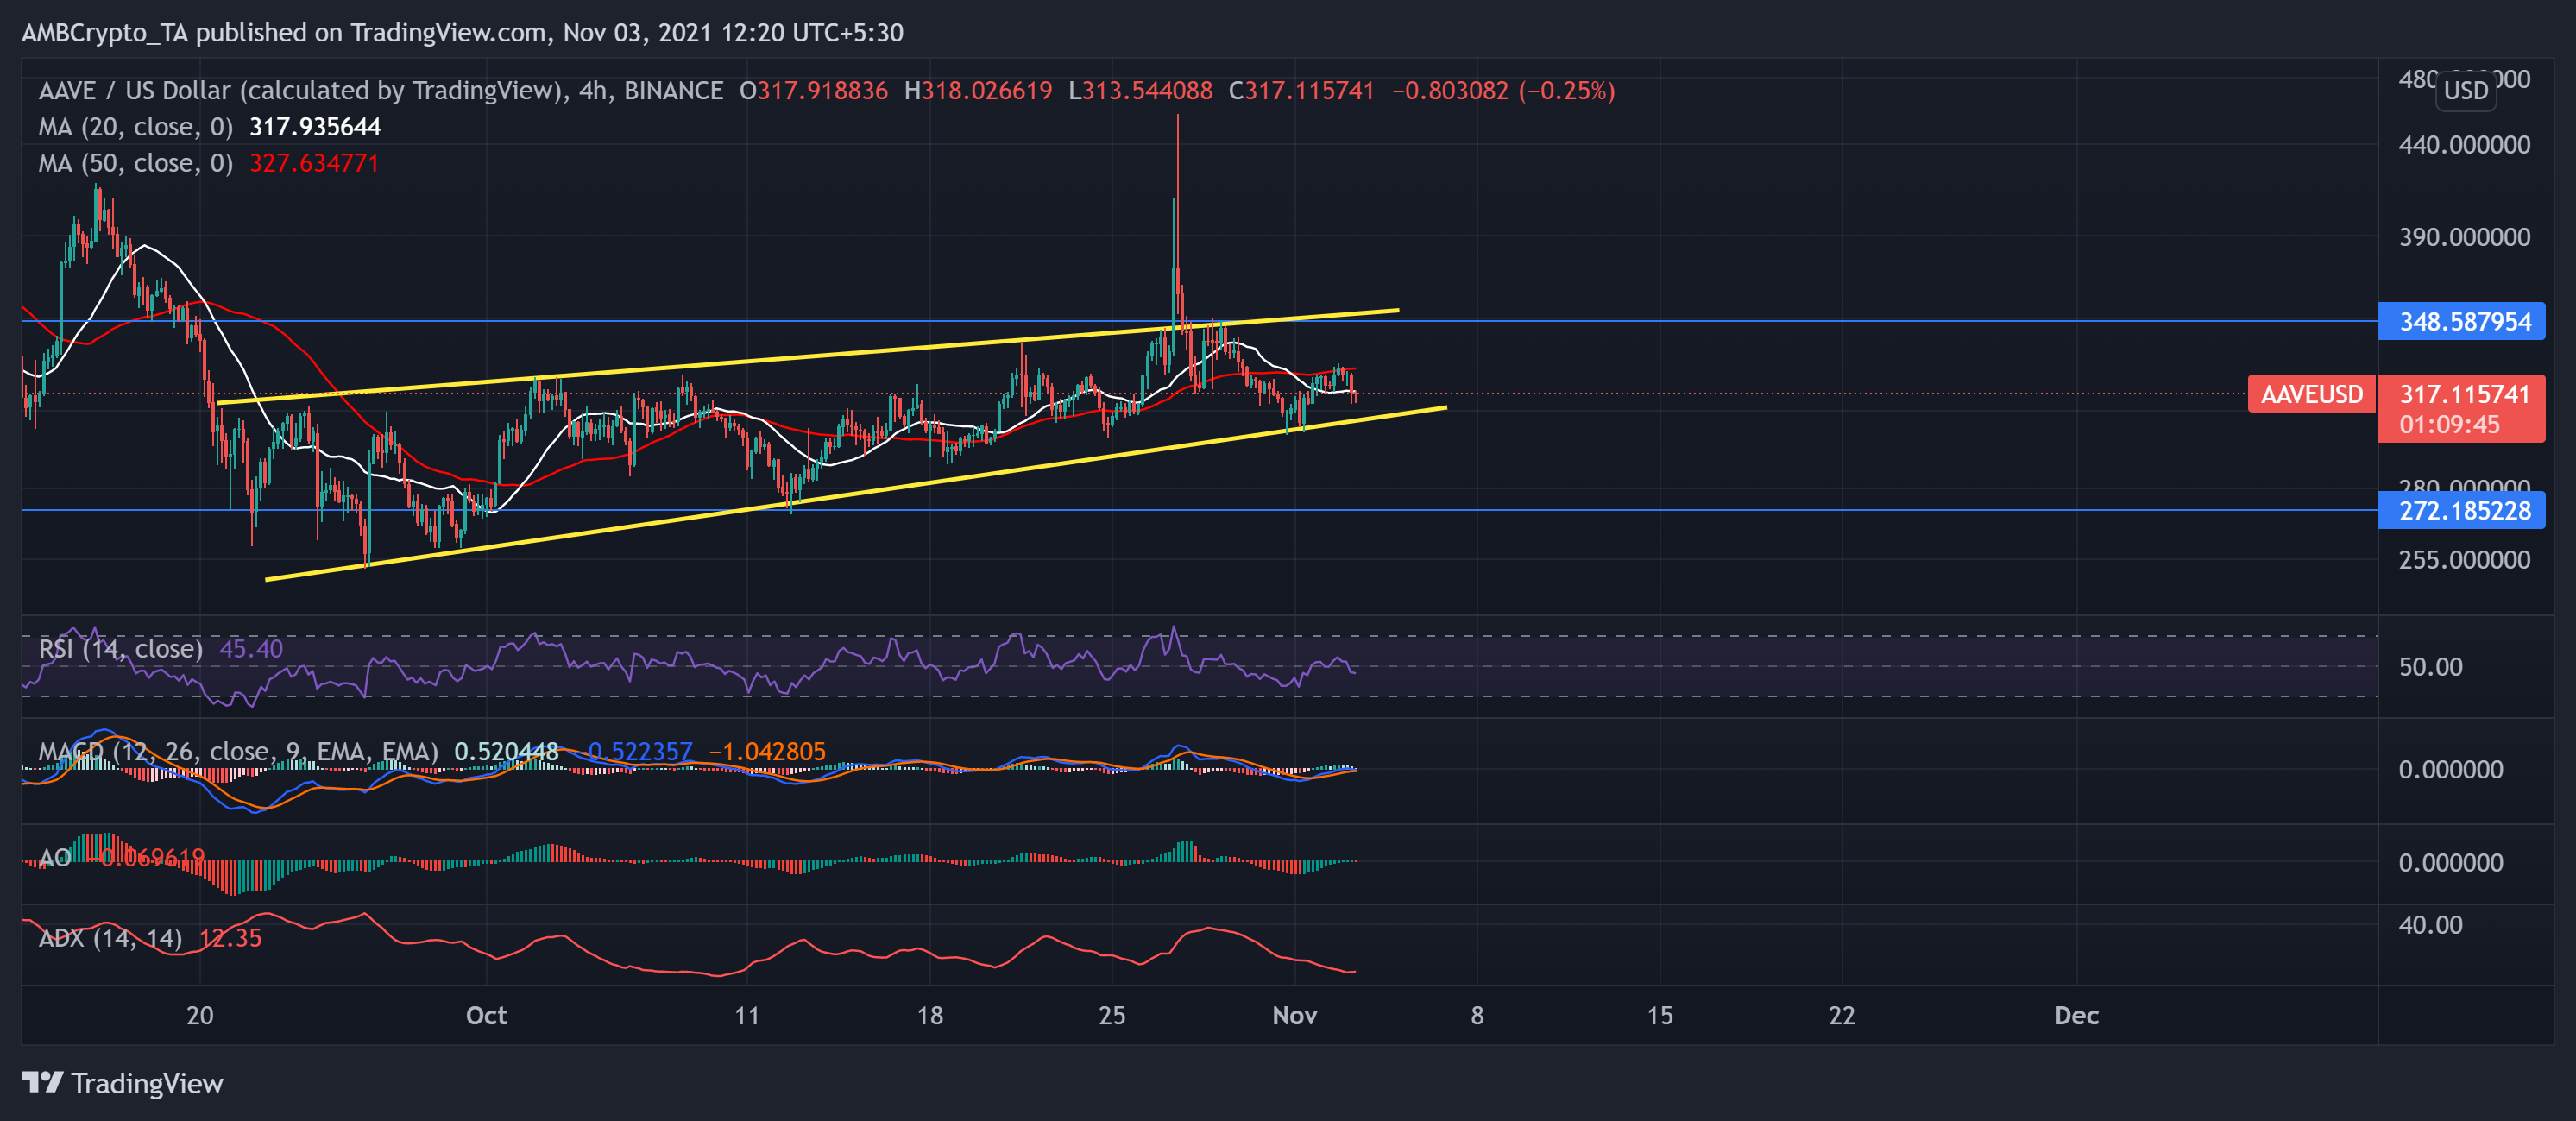
Since 1 October, AAVE assumed consolidation within the bounds of its support and resistance points that stood at $348.59 and $272.16, respectively. However, it breached its immediate resistance to poke its 23-week high at the $458-mark on 27 October.
After which the price action undertook a correction and oscillated back within the aforementioned bounds. However, since 26 September, the digital currency escalated in a gradual and steady uptrend by noting higher highs and higher lows.
Consequently, it saw a 9.19% increase in its value since then. At press time, AAVE traded at $317.12. The RSI stood at the 45-mark and depicted a conducive situation for the sellers. Also, the MACD was on the verge of a bearish crossover with the signal line.
Additionally, the MACD histogram displayed shorter light green bars, and the AO gave a red signal. Nonetheless, the ADX line stood at the 12-mark and suggested a weak directional trend.
Enjin Coin (ENJ)
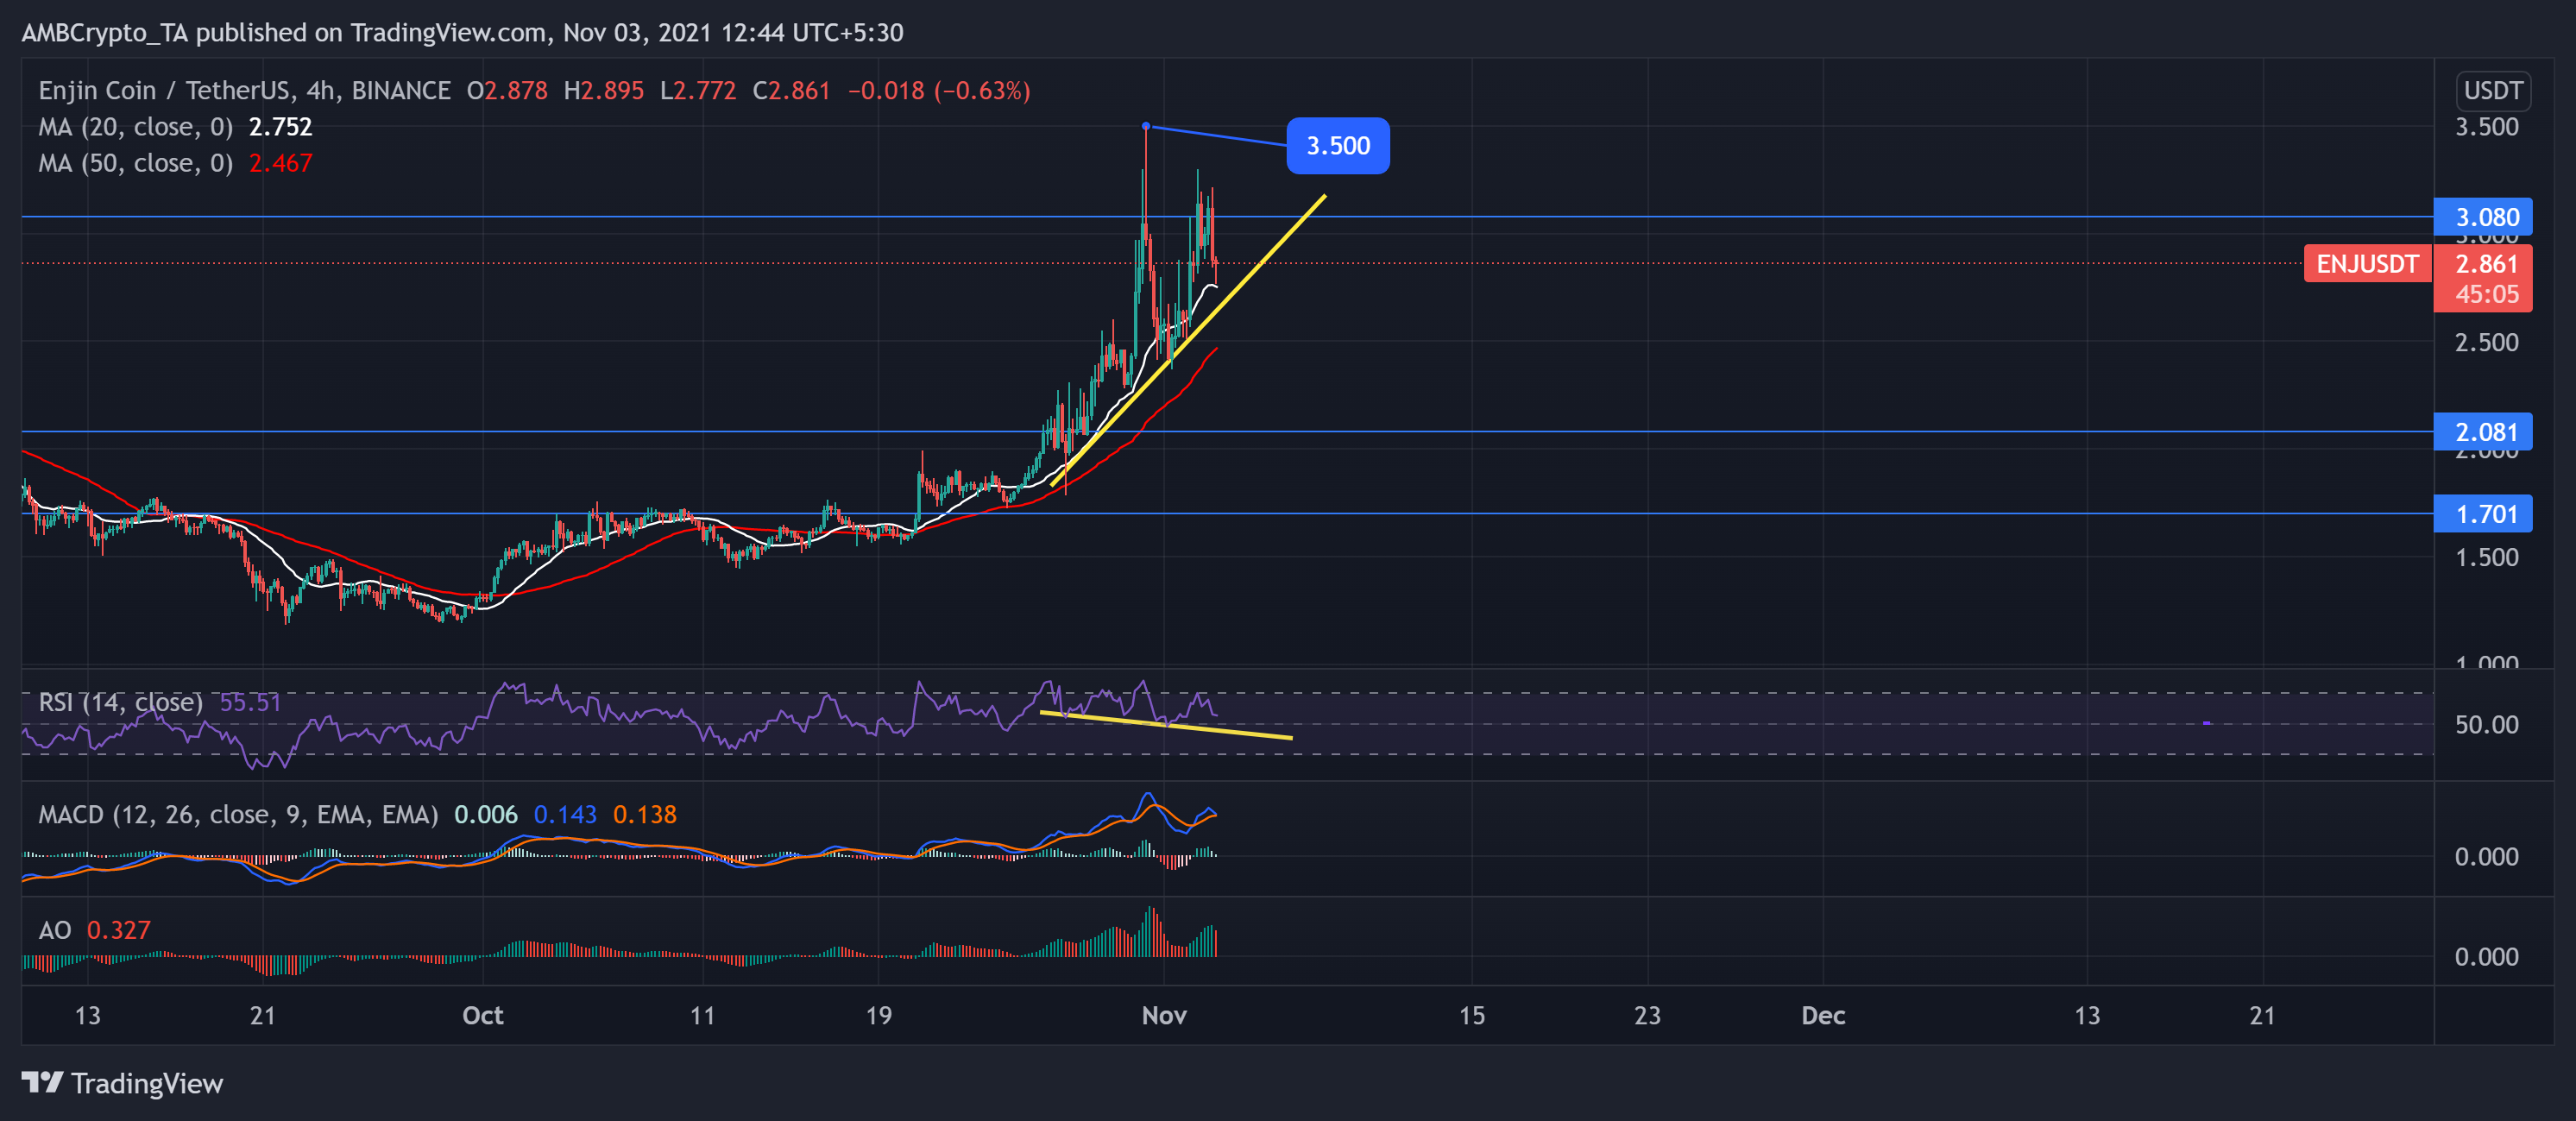
ENJ registered an exceptional gain of 36.72% over the week. The bulls snapped off the immediate support at $2.081 and pushed the resistance point to $3.08. As a result, the price rally touched its 6-month high at $3.5 on 31 October.
Since then, the price returned within the preceding bounds as bears displayed their strength. However, the asset noted a nearly 1.6% decline over the past day and traded at $2.861 at press time.
The RSI plunged by 15 points over the few hours depicting a significant decrease in buying strength. Also, the MACD and the signal line seemed on the verge of a bearish crossover. Additionally, the Awesome Oscillator flashed red signals and affirmed the previous readings.