Chainlink, Aave, Synthetix Price Analysis: 22 March

Chainlink witnessed a bearish divergence between price and momentum and was forced to pull back to $29, and could go further south. Aave had a lack of buying volume and sellers were in the driver’s seat and they worked hard to drive prices beneath the $360 floor. Synthetix could test the $18.5 region of demand once more.
Chainlink [LINK]
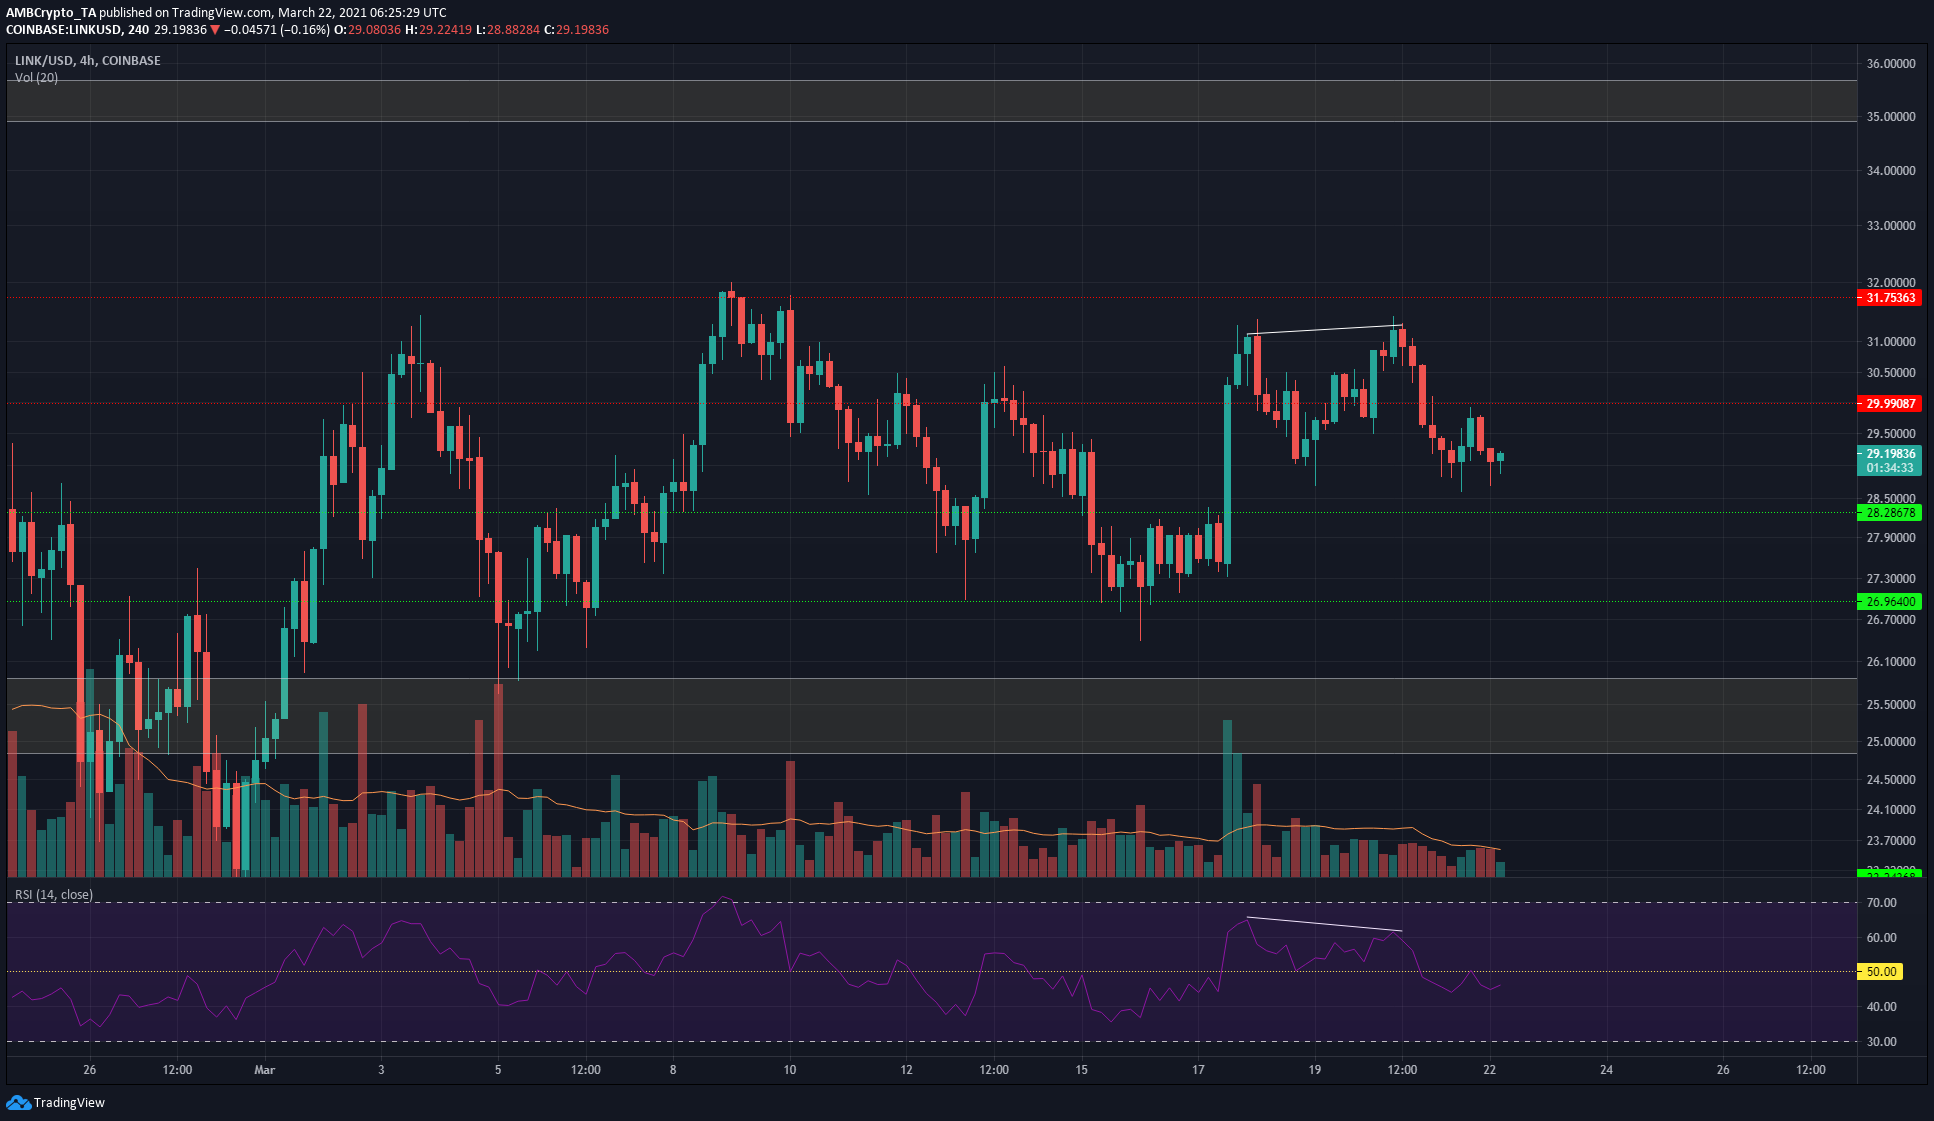
On the 4-hour chart, the past few days saw a bearish divergence (white) emerge as the price formed higher highs while the momentum indicator (RSI) formed lower highs. This caused LINK to pullback to the $29 mark.
The $29-$29.4 region has served as a region of supply and demand in recent weeks. If LINK falls beneath $29, the next level of support lies at $28.28. The RSI fell beneath neutral 50 and retested the line as resistance to indicate bearish momentum was still in play.
Aave [AAVE]
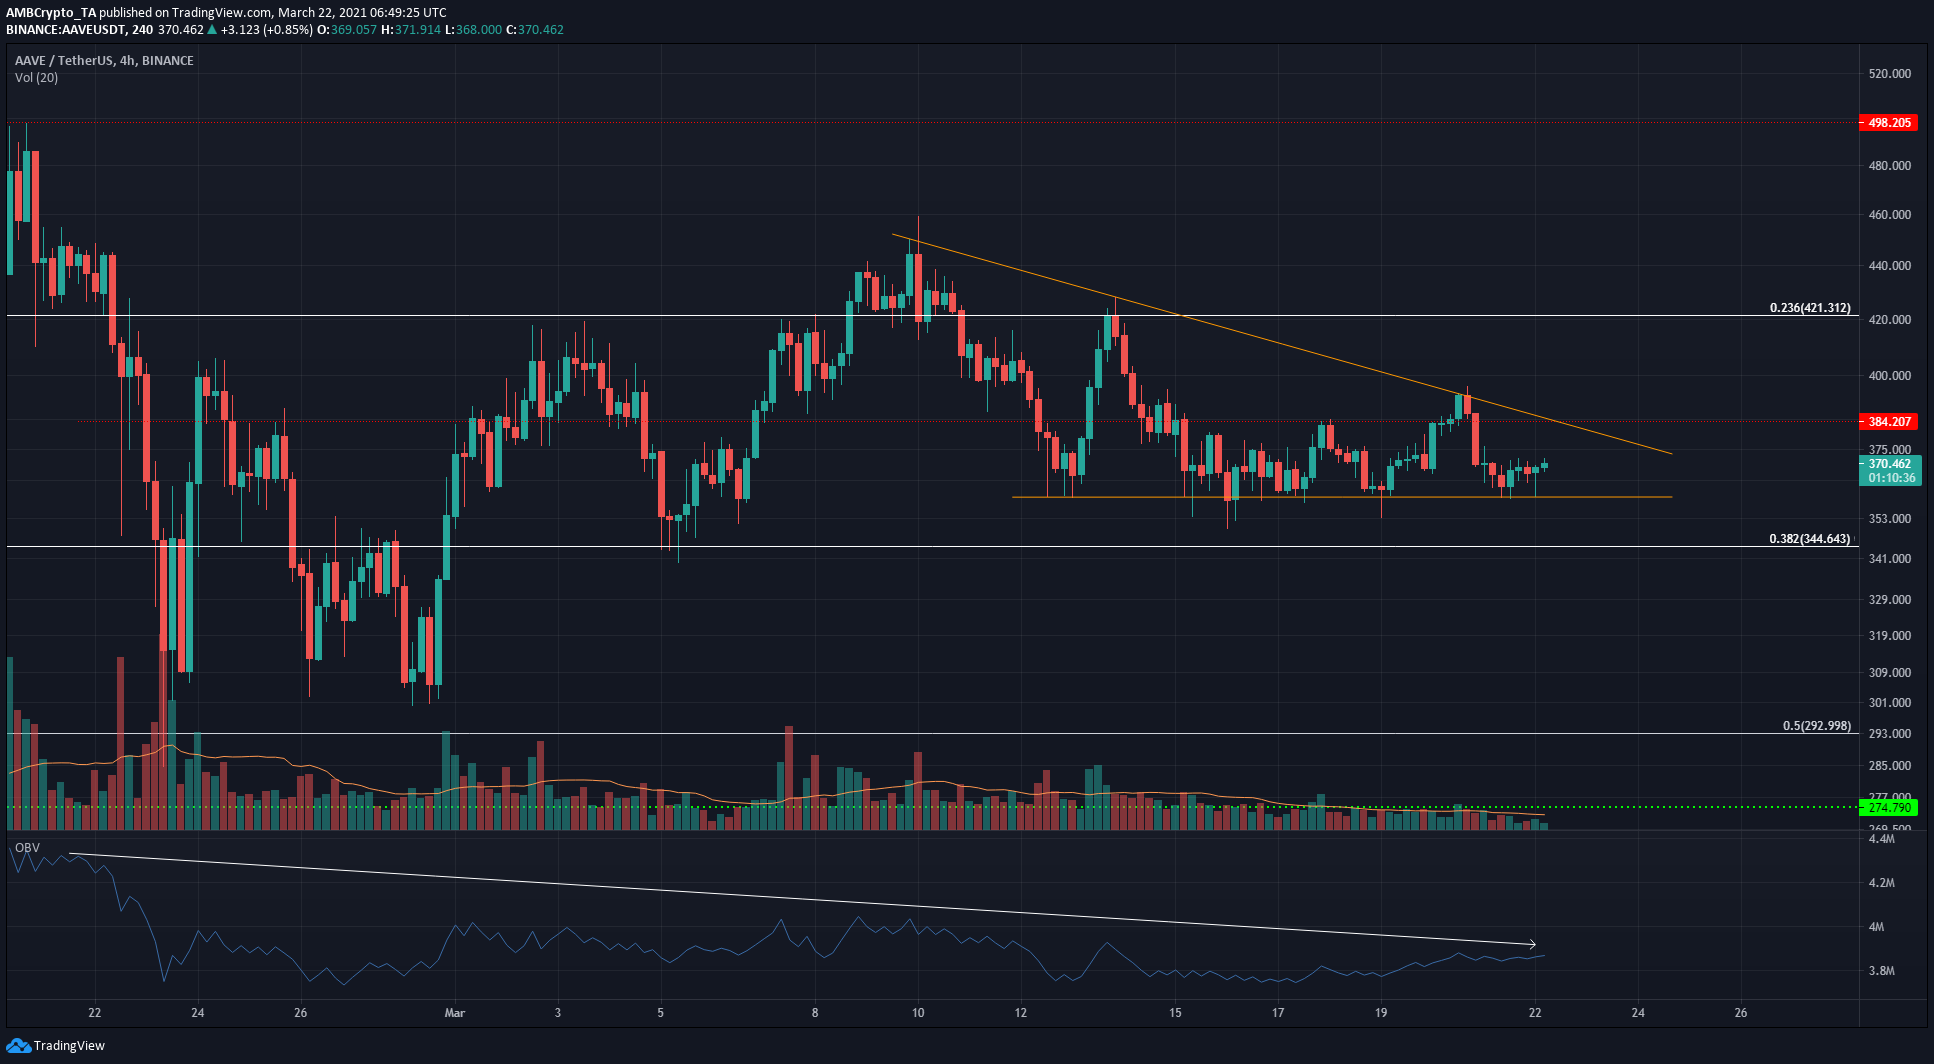
A descending triangle pattern (orange) was formed. AAVE was sharply rejected at the $390 mark and forced lower to test the $360 level as support. The triangle pattern can see a move in either direction, although it tends to follow the trend present prior to the pattern formation. In this case, a continuation would see AAVE head toward $344.
The $360 area has held as support, but this could be broken in the coming days. The OBV showed a steady downtrend, and this selling volume could see AAVE breakdown past $360 and $344 to test $300 as support.
Synthetix [SNX]
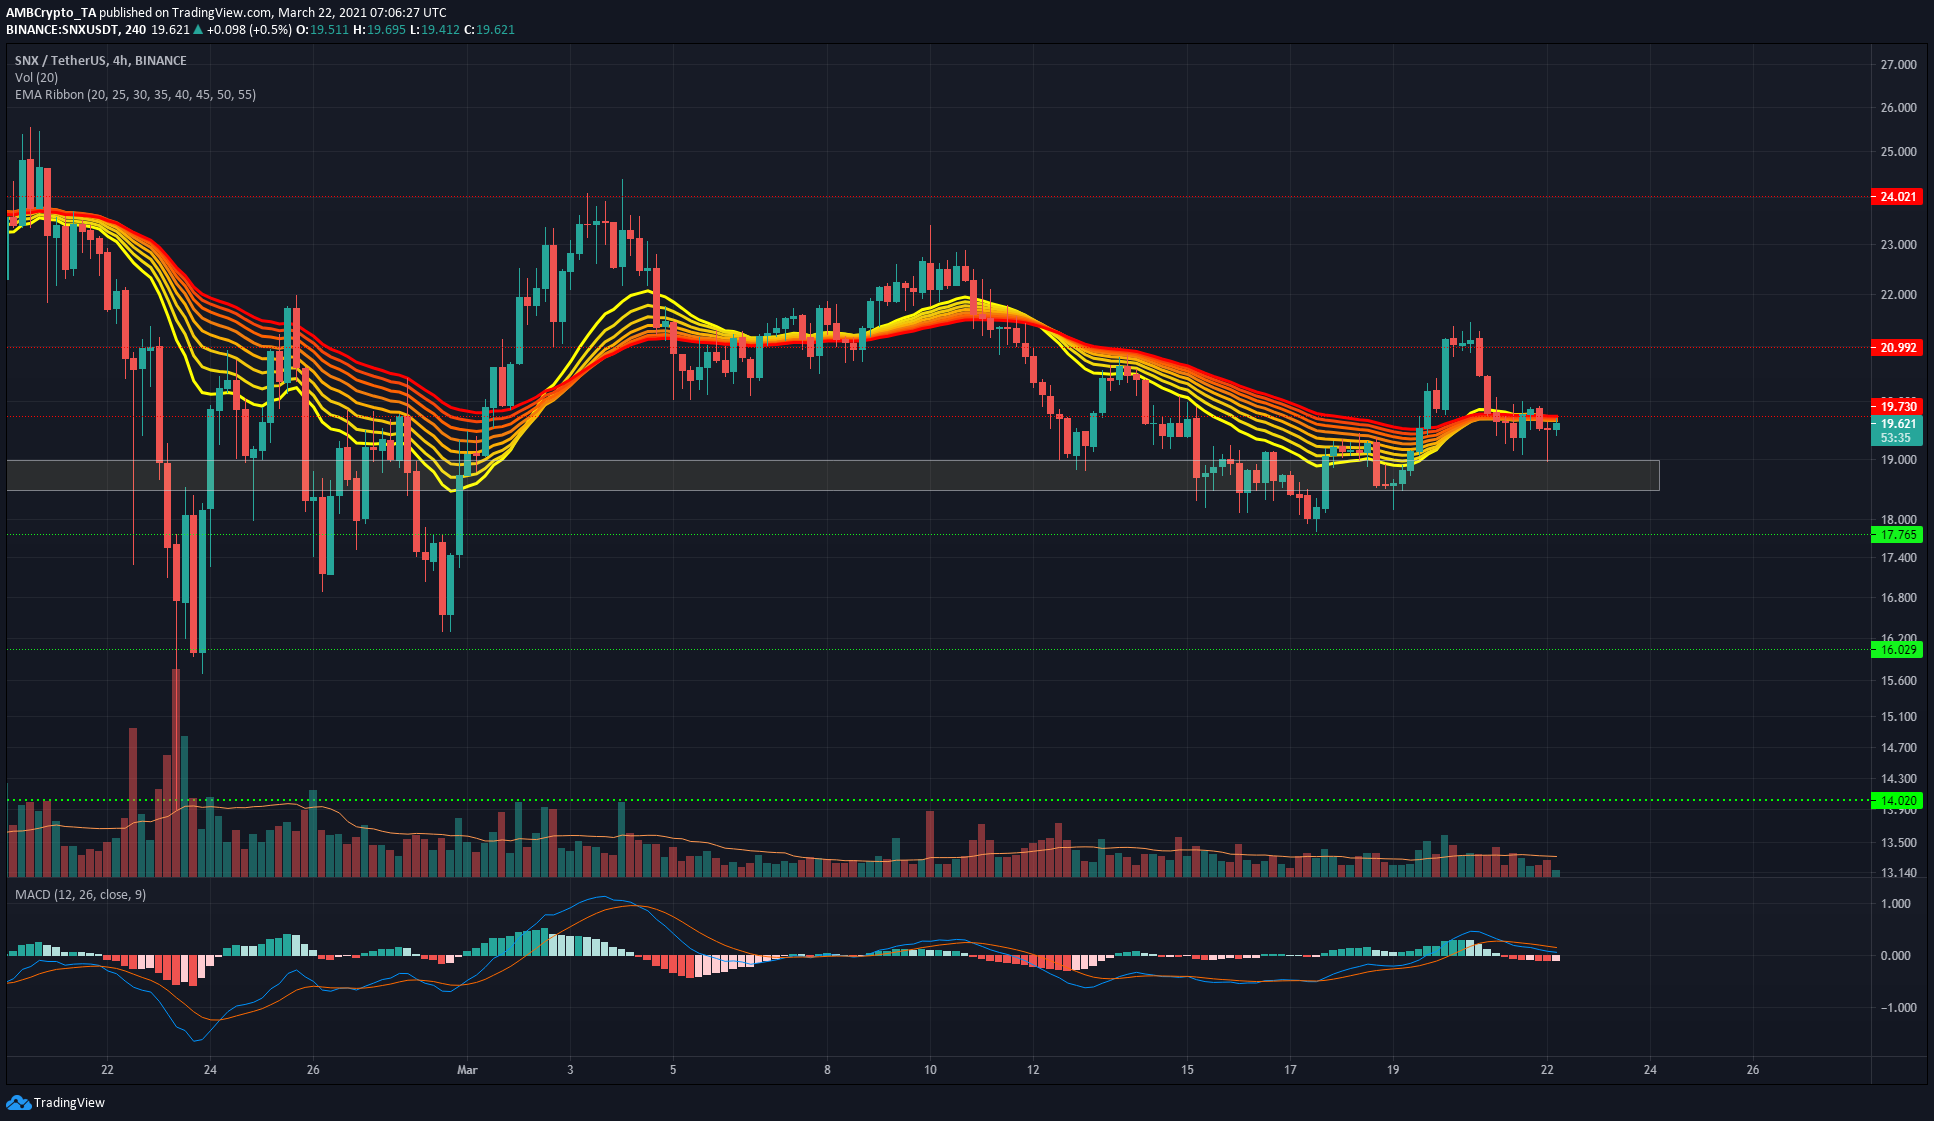
The $18.5-$19 region represents an area of demand, and just beneath it lies a level of support at $17.7. In the past, these have been important areas and continue to be places of interest for SNX.
The past few days saw demand drive the price up from $18.5 to $21.1, but SNX was unable to reclaim the $20 level of resistance. Selling pressure forced SNX to retrace most of the gains made, and it was trading beneath the $19.7 level of resistance once more.
The EMA Ribbon was on the verge of flipping to bullish had SNX managed to stay above $20 longer, but the quick plunge showed a very tight ribbon-indicative of indecision. The MACD formed headed lower toward the zero line. $18.5 and $17.7 are support levels to keep an eye on.