Altcoin

Chainlink and Litecoin: Here’s how traders can book quick profits in the coming days
Posted:
| Last updated: August 16th, 2021

Most of the market’s top coins witnessed a decent rally over the past week. Two of the most prominent alts, Litecoin and Chainlink, were able to fetch their HODLers 14.3% and 8.28% in the weekly time window. In fact, their press time valuation stood at $175.65 and $26.83, respectively.
A lot was happening on both these networks of late. For starters, just a couple of days back, Chainlink Oracles went live on Arbitrum One, an ETH L2 scaling solution. The integration would now enable support for various denominated Chainlink price feeds on Arbitrum. Furthermore, in the coming days, new price pairs would likely be supported as well.
Earlier this month, CoinShares Co. rolled out a new Litecoin ETP (a physically backed cryptocurrency exchange-traded-product). At launch, each unit of the the Litecoin ETP was backed by 0.2 LTC, thus providing investors passive exposure to the alt.
Development activities aside, is this the right time for traders to re-enter the LTC and LINK market?
What the on-chain metrics say
During the initial week of July, Litecoin’s volume typically hovered around the 1 billion mark. However, the same increased two-fold over the past few days and explicitly stood at 2.34 billion at the time of writing. LINK’s volume too, for that matter, was on the rise and was oscillating around the 1 billion mark at the time of writing.
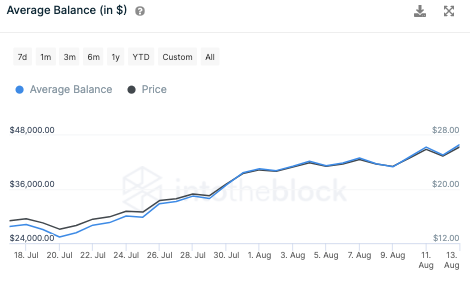
LINK average balance || Source: IntoTheBlock
The cumulative number of LTC transactions has been inching northward since last week. In the current time frame, it was sitting at its one month high level (164k LTC transactions). Interestingly, the same has been relatively steady around 6k for Chainlink.
The average balance held by market participates too has been on the rise for both the alts. This essentially indicated that traders and investors were accumulating them at this stage to relish the gains in the foreseeable future. Well, most of the aforementioned metrics support the alts’ bullish overture at the moment.
Key levels to keep an eye on
Improved volumes have, by and large, sustained the rallies of both the alts. However, at this stage, their prices face a couple of resistance levels that could hinder their short term performance.
Now, as seen from the chart attached, LTC’s price was gradually inching towards its 200 day SMA. The same acted as a support during the latter half of May and the initial days of June. However, it translated to a strong resistance soon after that. The climb from the current $175 mark to the $192-$193 range should be quite placid and traders can take advantage of that.
However, LTC’s price would likely consolidate around its 200 day SMA before continuing its rally to the $209 level.
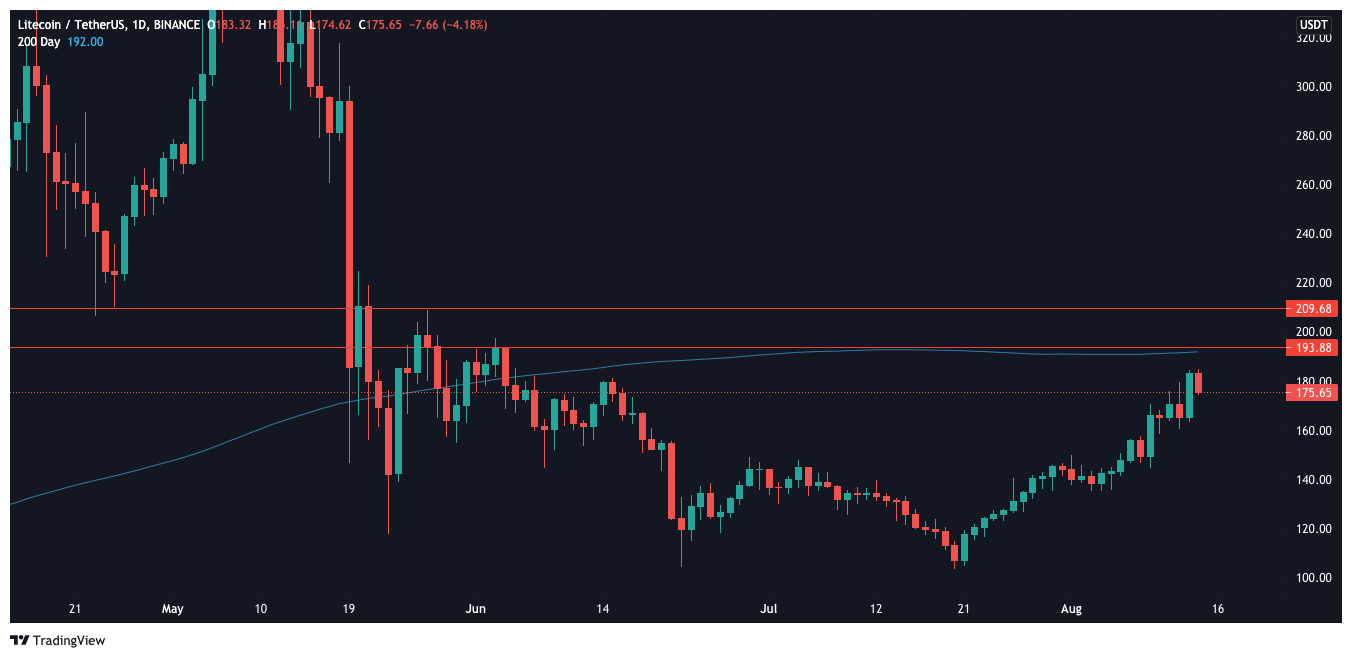
LTC/USDT || Source: TradingView
LINK’s price chart remained comparatively bullish at the time of writing. It fact, it was hovering slightly above its $26 resistance level. A breakout from here would see the alt breach the $32.2 level and if the buying pressure further intensifies, LINK may straight away test the $38-$39 range next.
Keeping the current trends in mind, market participants can look to make some quick profits from these two alts in the next couple of days.