Chainlink – Assessing the probability of LINK rallying to $25

Disclaimer: The findings of the following analysis are the sole opinions of the writer and should not be taken as investment advice
Bitcoin faced some short-term resistance around the $49.4k-level, an area BTC has faced sell pressure at multiple times in the month of December. The recent spike for BTC from $45.5k’s lows set off a run for Chainlink as well.
Chainlink had climbed from $18.16 to $20.57, at press time. This area presented a hurdle to LINK and the strength of LINK’s bulls was put to the test once more.
Chainlink – 1 hour chart
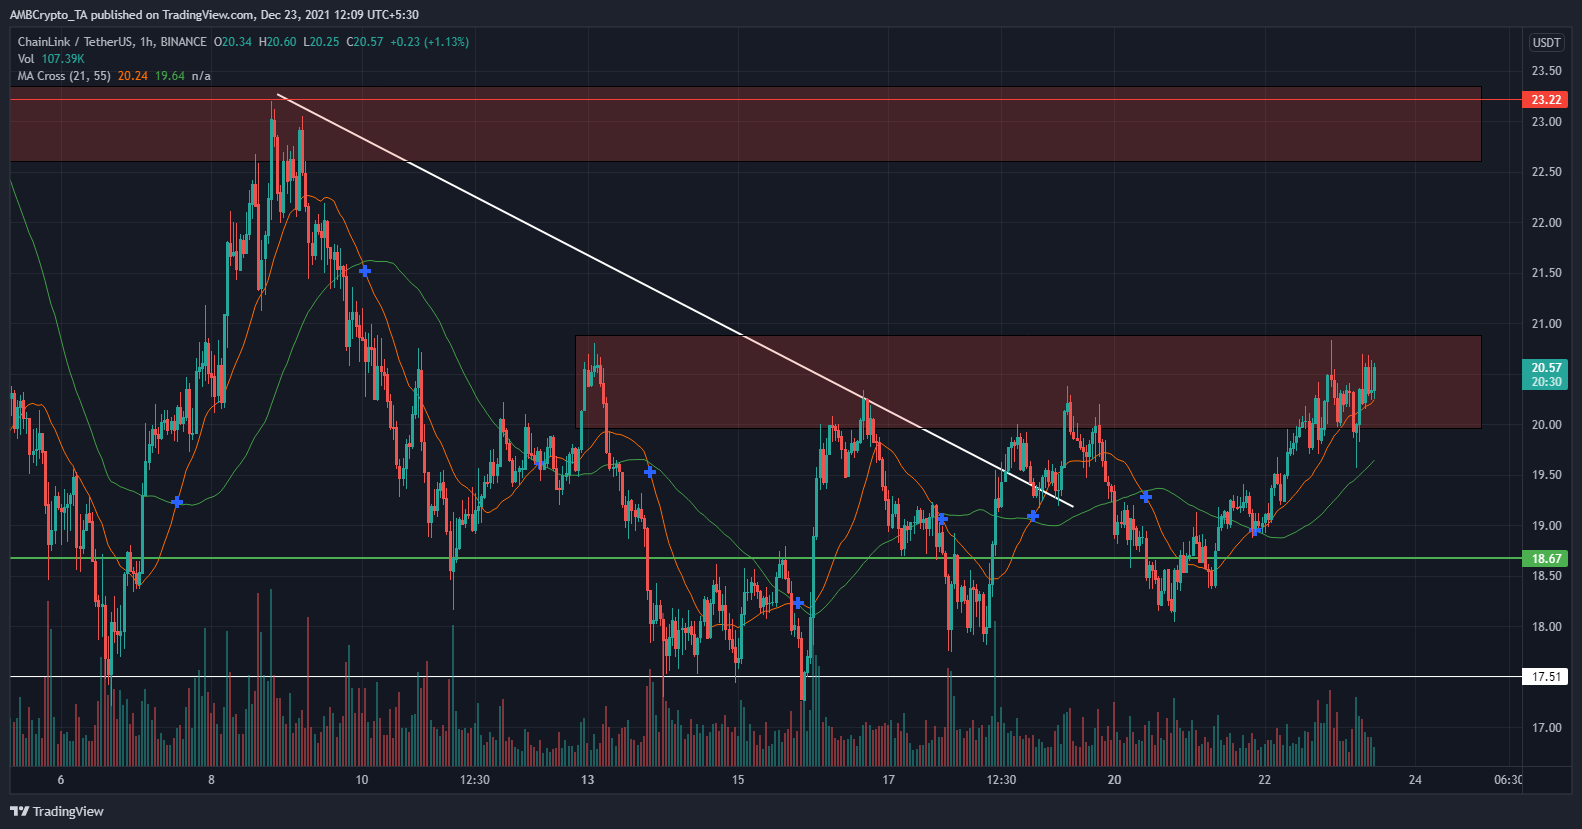
On the 1-hour chart, the break of the descending trendline (white) and its subsequent retest met a brick wall at the $20-$20.85 supply area (red). The rejection saw LINK fall to $18.15 to test for demand. Having found buyers, LINK rebounded back to the $20-area.
The price has not been able to breach this area since the first rejection on the 13th, although it has formed higher lows since. Trading volume remains steady, and a hammer candlestick formation a few hours before press time suggested that bulls were out in force once again and could force a breakout on this most recent attempt.
Rationale
On the price chart, we can see the 21 SMA (orange) hold as support, with a hammer pattern formed to explore whether buyers are still behind this short-term rally. The 21 SMA stayed above the 55 SMA (green) to show bullish momentum.
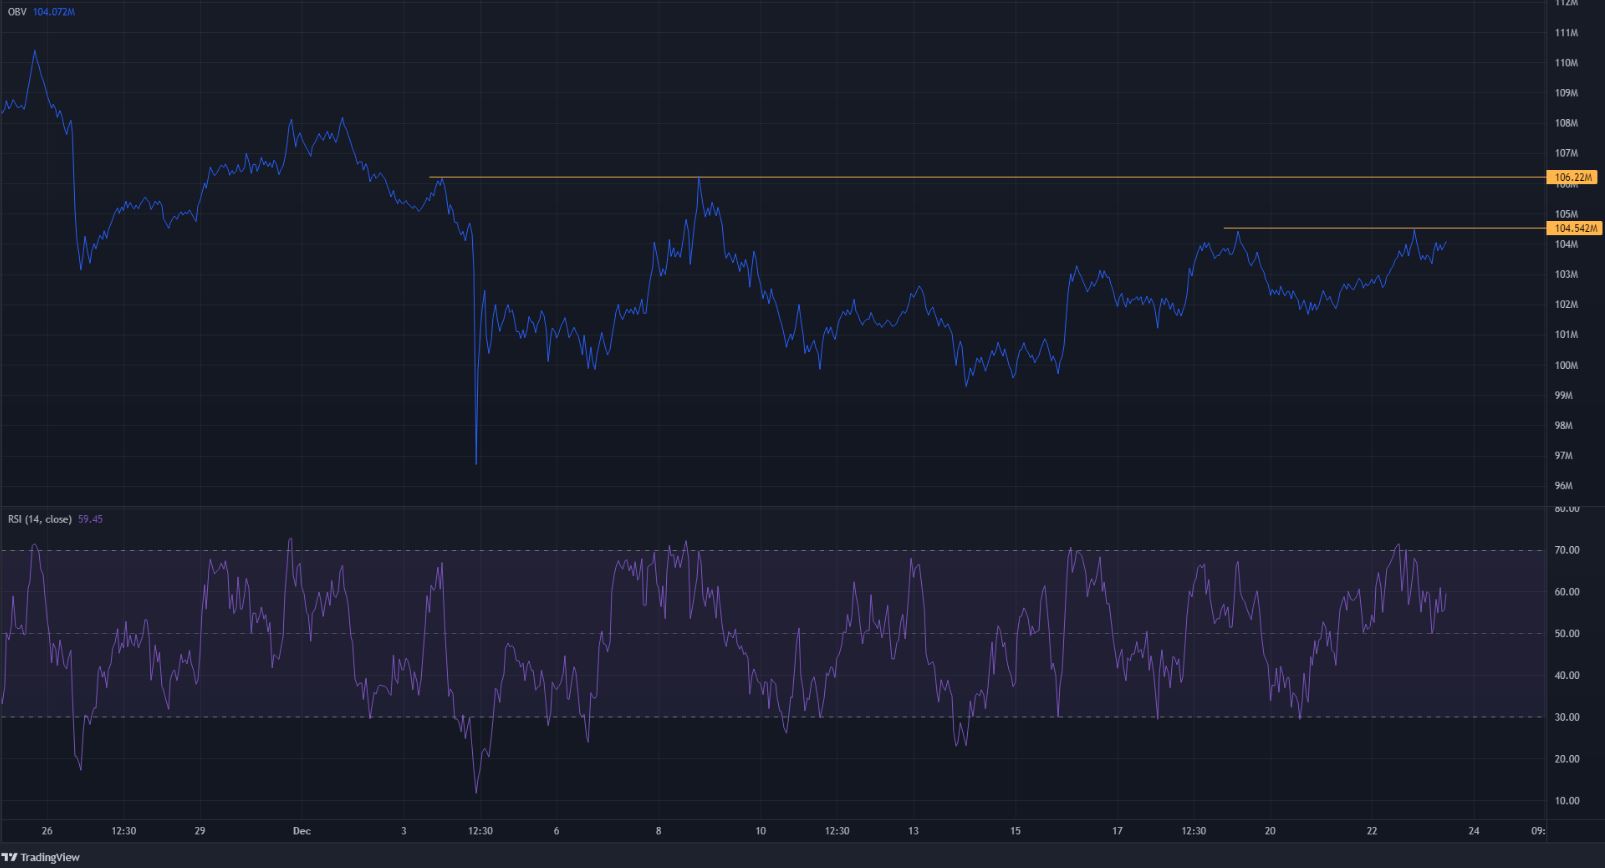
The RSI also stayed above neutral 50 and reinforced the idea of bullish momentum. The RSI did form a bearish divergence very recently, but has since reset and upward momentum could likely continue.
The OBV formed higher lows alongside the price in recent days, and two levels of resistance were marked. A move on the OBV above these levels would further support the idea that buyers remain strong.
Conclusion
Momentum on the lower timeframes had turned bullish and buying pressure appeared to be behind this rally. Above the $20 area, the $22-level has strong significance on higher timeframes, making it an area where sellers will step in. Hence, a retest from above the $20 area will present a buying opportunity, targeting the $22-level and another test of the local highs at $23.22.
This move, if it pans out over the next few days, could see LINK gather steam to push higher, with the $25 area being a round number resistance, as well as being a significant pocket of liquidity on higher timeframes.


