Chainlink, Bitcoin Cash, Uniswap Price Analysis : 13 June
The last 24 hours had been significantly bearish for the market. The 24-hour trading volume fell by 15% to $79.1 billion. Bitcoin along with almost every other altcoin was trading in red including Chainlink, Bitcoin Cash, Uniswap with each of them reacting differently to these market changes.
Chainlink [ LINK ] :-
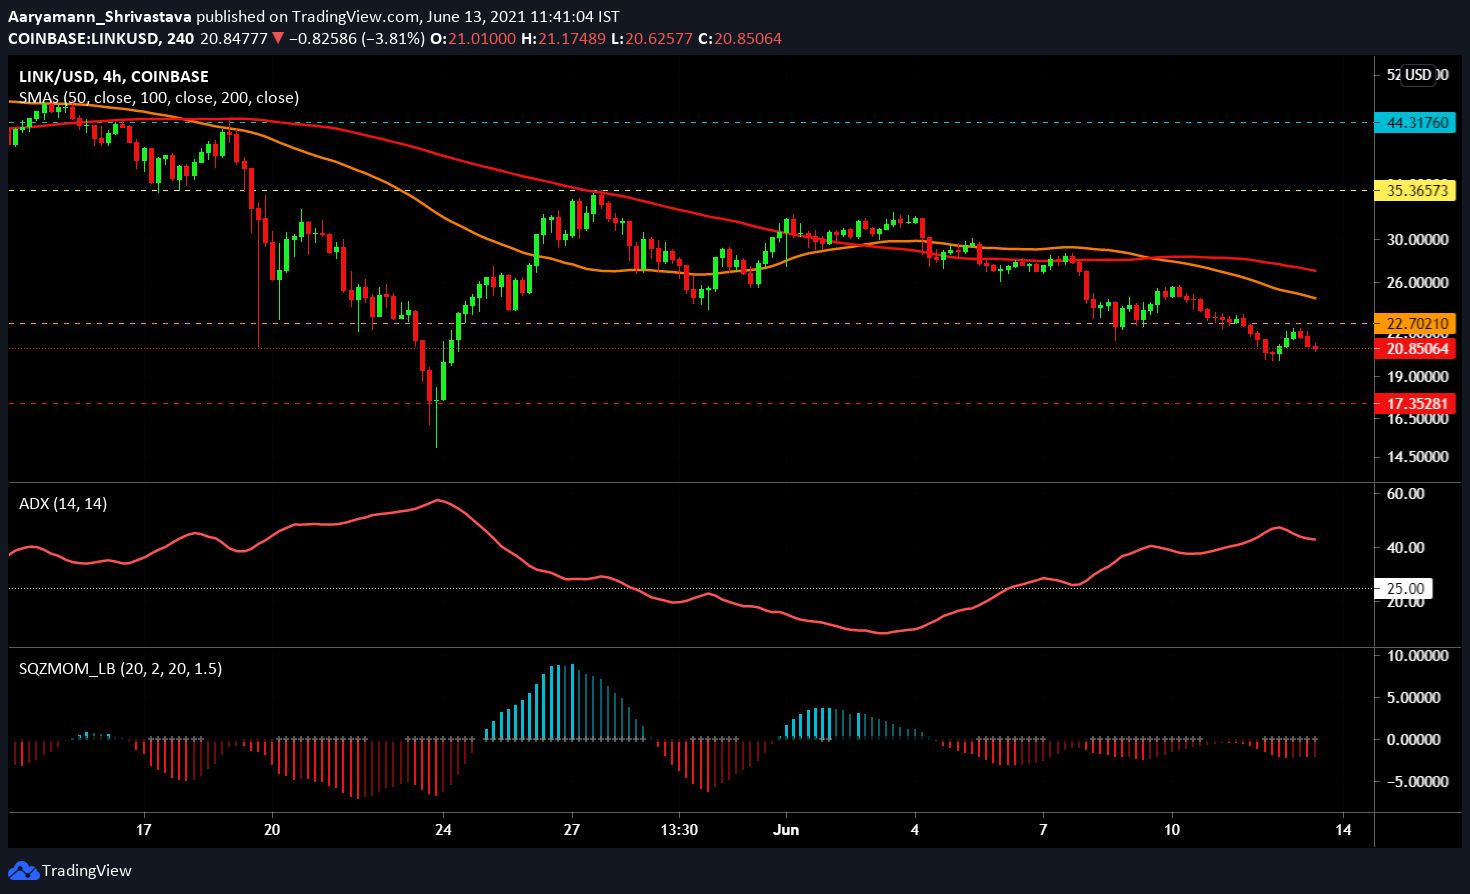
Post the June 8 dip, LINK kept testing the $22.7 support level; on June 10 the coin finally dropped below it, turning it into an active resistance level. At the time of writing, the coin was trading in red at $20.8. LINK market was strongly bearish as both the Simple Moving Averages (SMA) lines – 50 SMA (orange) and 100 SMA (red) remained far above the candlesticks.
Average Directional Index’s (ADX) indicator rose and dipped slightly at the 40 mark in the last 24 hours. Since the indicator was losing its direction at press time, the price loss trend can be expected to come down once the indicator falls below 25. According to Squeeze Momentum Indicator, LINK displayed an active squeeze release (white dots). Also, the bars on the indicator turned darker red at press time, which points towards receding bearish pressure.
The coin will need very strong positive cues in order to flip the resistance back to support. For the next few hours, $17.3 is a critical support level.
Bitcoin Cash [ BCH ] :-

Bitcoin Cash managed to keep itself from falling to the $503 level. Since the price movement remained above $544, this marks now acts as the support level going forward. According to the Parabolic SAR, the coin is currently in an uptrend as the white dotted line appeared below the candlesticks. However, broader market cues suggest this uptrend will be short-lived.
Relative Strength Index (RSI) continued dipping slightly at press time. The indicator made a comeback from the oversold zone in the early hours of June 12 but kept moving in the bearish neutral territory. MACD too displayed neutral signs as both the indicator line and signal line remained aligned under the 0 mark.
$544 could be tested within the next 24 hours if the market turns positive, or else $503 will become the next active support if BCH falls further.
Uniswap[ UNI ] :-

Bearish pressure successfully dropped UNI below $22.1, a support level the coin had been holding since the end of May. UNI was trading at $20.7 at the time of writing and based on present indicators, this price could possibly fall further. Bollinger Bands remained parallel on the 4-hour chart. The indicator displayed some possibility of volatility in the coming hours.
Awesome Oscillator looked positive as the green bars’ appearance indicated bullish momentum creeping up. Finally, capital outflows dominated Chaikin Money Flow indicator with the green line falling to -0.25.
For now, $22.1 is the resistance level and $18.6 is the new support level.


