


Disclaimer: The information presented does not constitute financial, investment, trading, or other types of advice and is solely the writer’s opinion
- The sharp fall on Wednesday was a retracement into support on the higher timeframes.
- The mid-range support and $8.12 resistance will be levels that can indicate the direction of the next move.
The price of Chainlink tokens fell sharply from $8.6 to $7.8 on Wednesday. Bitcoin also noted losses, but Bitcoin Dominance continued to stay above 46.8%.
This suggested that the altcoins have been slower to register gains than BTC over the past month, and this needed to change before alts could go on a run northward.
Read Chainlink’s [LINK] Price Prediction 2023-24
Bitcoin bulls managed to defend the $28.6k support but the lower timeframe charts did not inspire bullish confidence.
On the other hand, the retracement into a higher timeframe support allowed the buyers to fight back. Can Chainlink buyers seize this chance and continue their rally?
The defense of $7.6 meant bulls had a chance to reverse the recent losses

Since May 2022, Chainlink has traded within a large range that extended from $5.5 to $9.6. The mid-point of this range sat at $7.6 and another level of significant resistance nearby was at $8.12. Over the past week, LINK bulls had beaten both of these resistances.
The sell-off on Wednesday meant lower timeframes had a bearish market structure, but the daily timeframe continued to flash bullish signs.
The RSI has not dropped beneath the neutral 50 either, which hinted that a downtrend had not commenced. Moreover, the OBV did not see a large pullback either, which suggested buying pressure in recent weeks has been steady and yesterday (19 April) might be a counter-trend move.
Is your portfolio green? Check the Chainlink Profit Calculator
The plunge left a fair value gap between $8.12 and $8.38 in the 4-hour timeframe, which could be retested before another drop for LINK.
A drop below $7.6 would be a warning sign that LINK was changing its longer-term direction. A daily session close below $7.1 would flip the structure to bearish and show that a move toward $5.8 was likely.
The slump in OI showed discouraged bulls but sentiment favored the bulls slightly
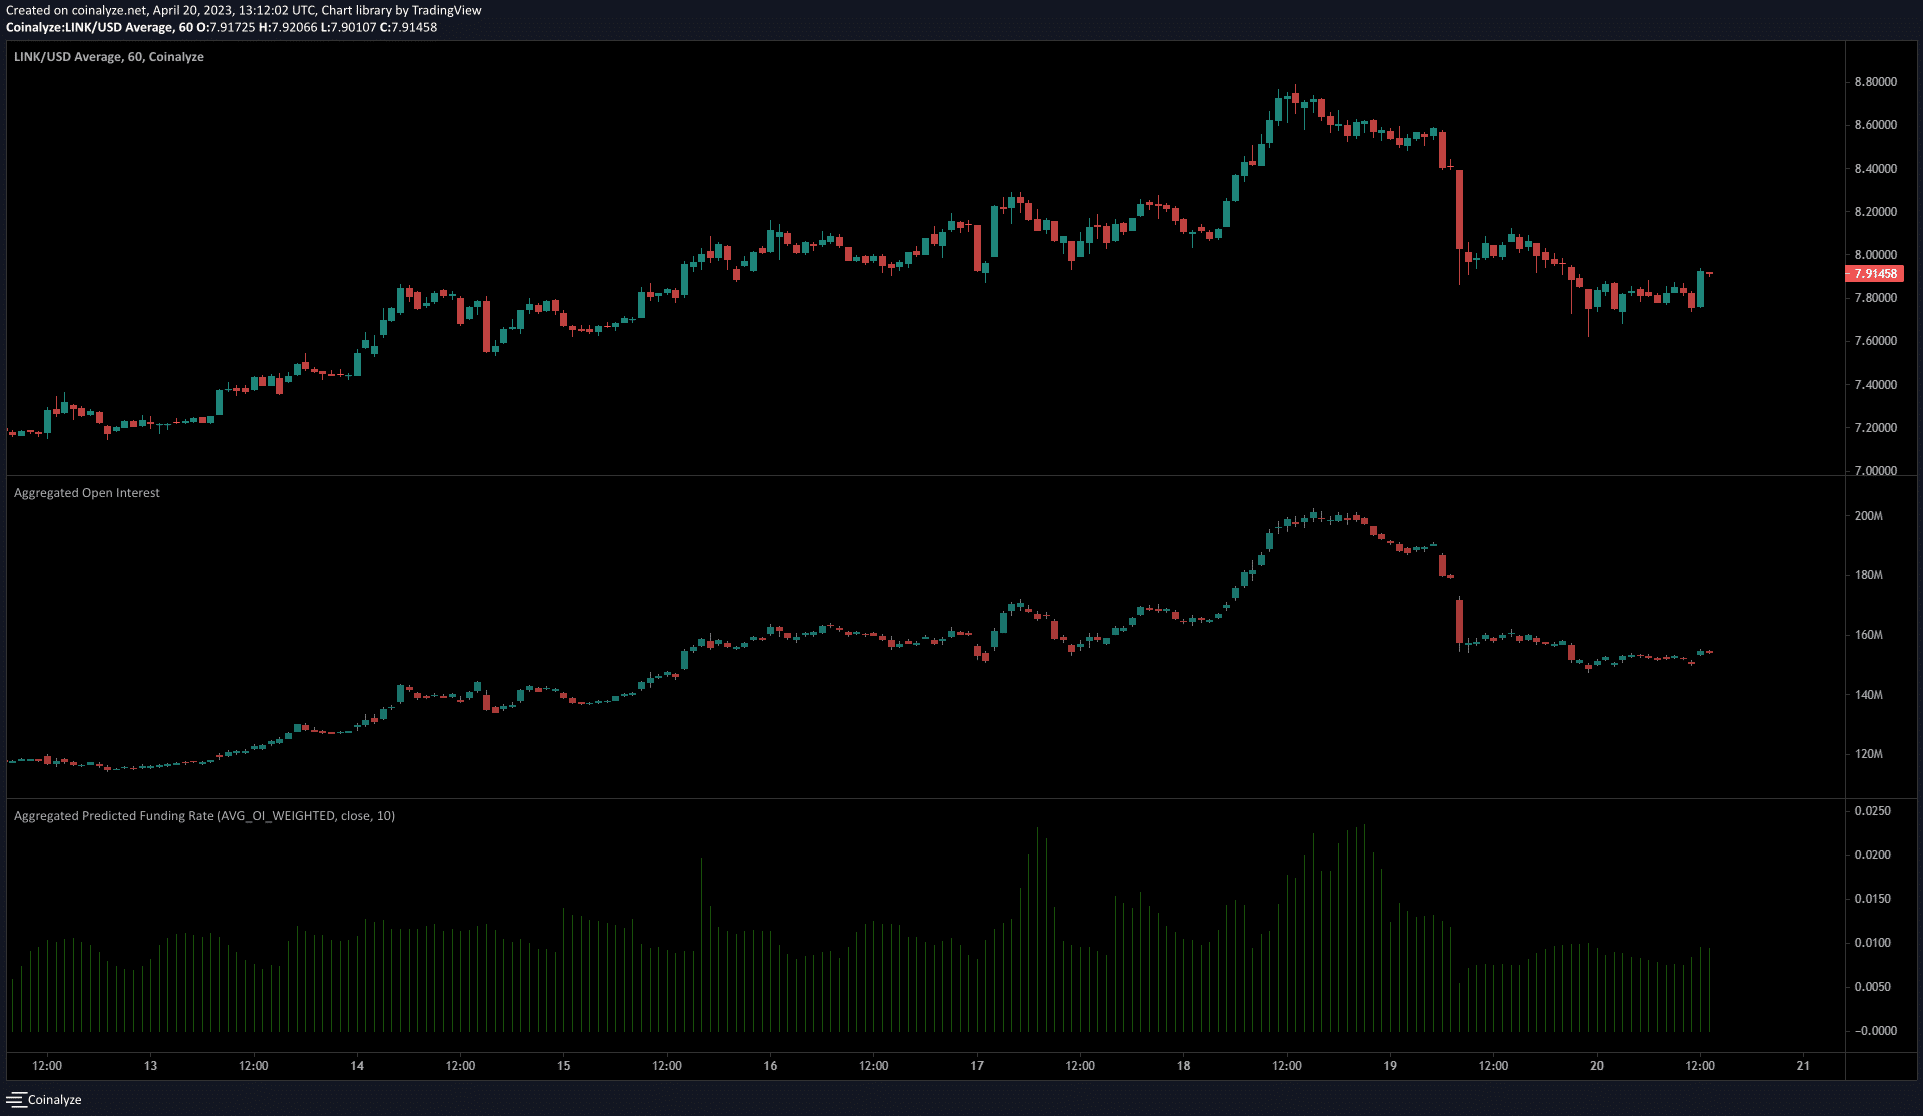
The Open Interest had been in decline over the past 48 hours, even as the momentum of LINK began to stall at $8.7.
On the lower timeframes, the reversal was much more evident and accompanied by a huge fall in OI, amounting to $35 million. Over the past 12 hours, the OI has been flat alongside the price.
The funding rate remained positive despite the sharp drop, which suggested the speculators were majorly in long positions.
Taken together, the short-term sentiment showed the bulls had some hope. The OI would need to climb higher alongside LINK prices to reinforce this idea.