Chainlink crosses $12.8: What’s next – $15 or $11?
Chainlink’s price, after gaining bullish momentum, started to drop again at press time.

- LINK was down by more than 6% in the last seven days.
- Buying pressure on LINK was high, but indicators suggested a price drop.
Chainlink [LINK] initiated a promising bull rally on the 7th of July, which hinted at recovery from last week’s losses. However, LINK couldn’t sustain the uptrend and soon lost its upward momentum.
Let’s have a closer look at what’s going on and what can be expected from LINK in the coming days.
A sell signal on LINK’s chart
CoinMarketCap’s data revealed that LINK’s price dropped by over 6% in the last seven days. However, things started to get better in the last 24 hours as the token’s price got pushed to $13.2, but the trend didn’t last.
Chainlink’s price rose by just 2% over the past day, and at the time of writing, it was trading at $12.81 with a market capitalization of over $7.79 billion.
Ali, a popular crypto analyst, posted a tweet highlighting a possible reason behind this dip. As per the tweet, a sell signal flashed on the token’s 4-hour chart.
If that’s true, then a few more red candlesticks might appear on the token’s four-hour chart. Does this mean this bearish trend will last a long time? Let’s see what the metrics suggest.
Buying pressure on LINK is high
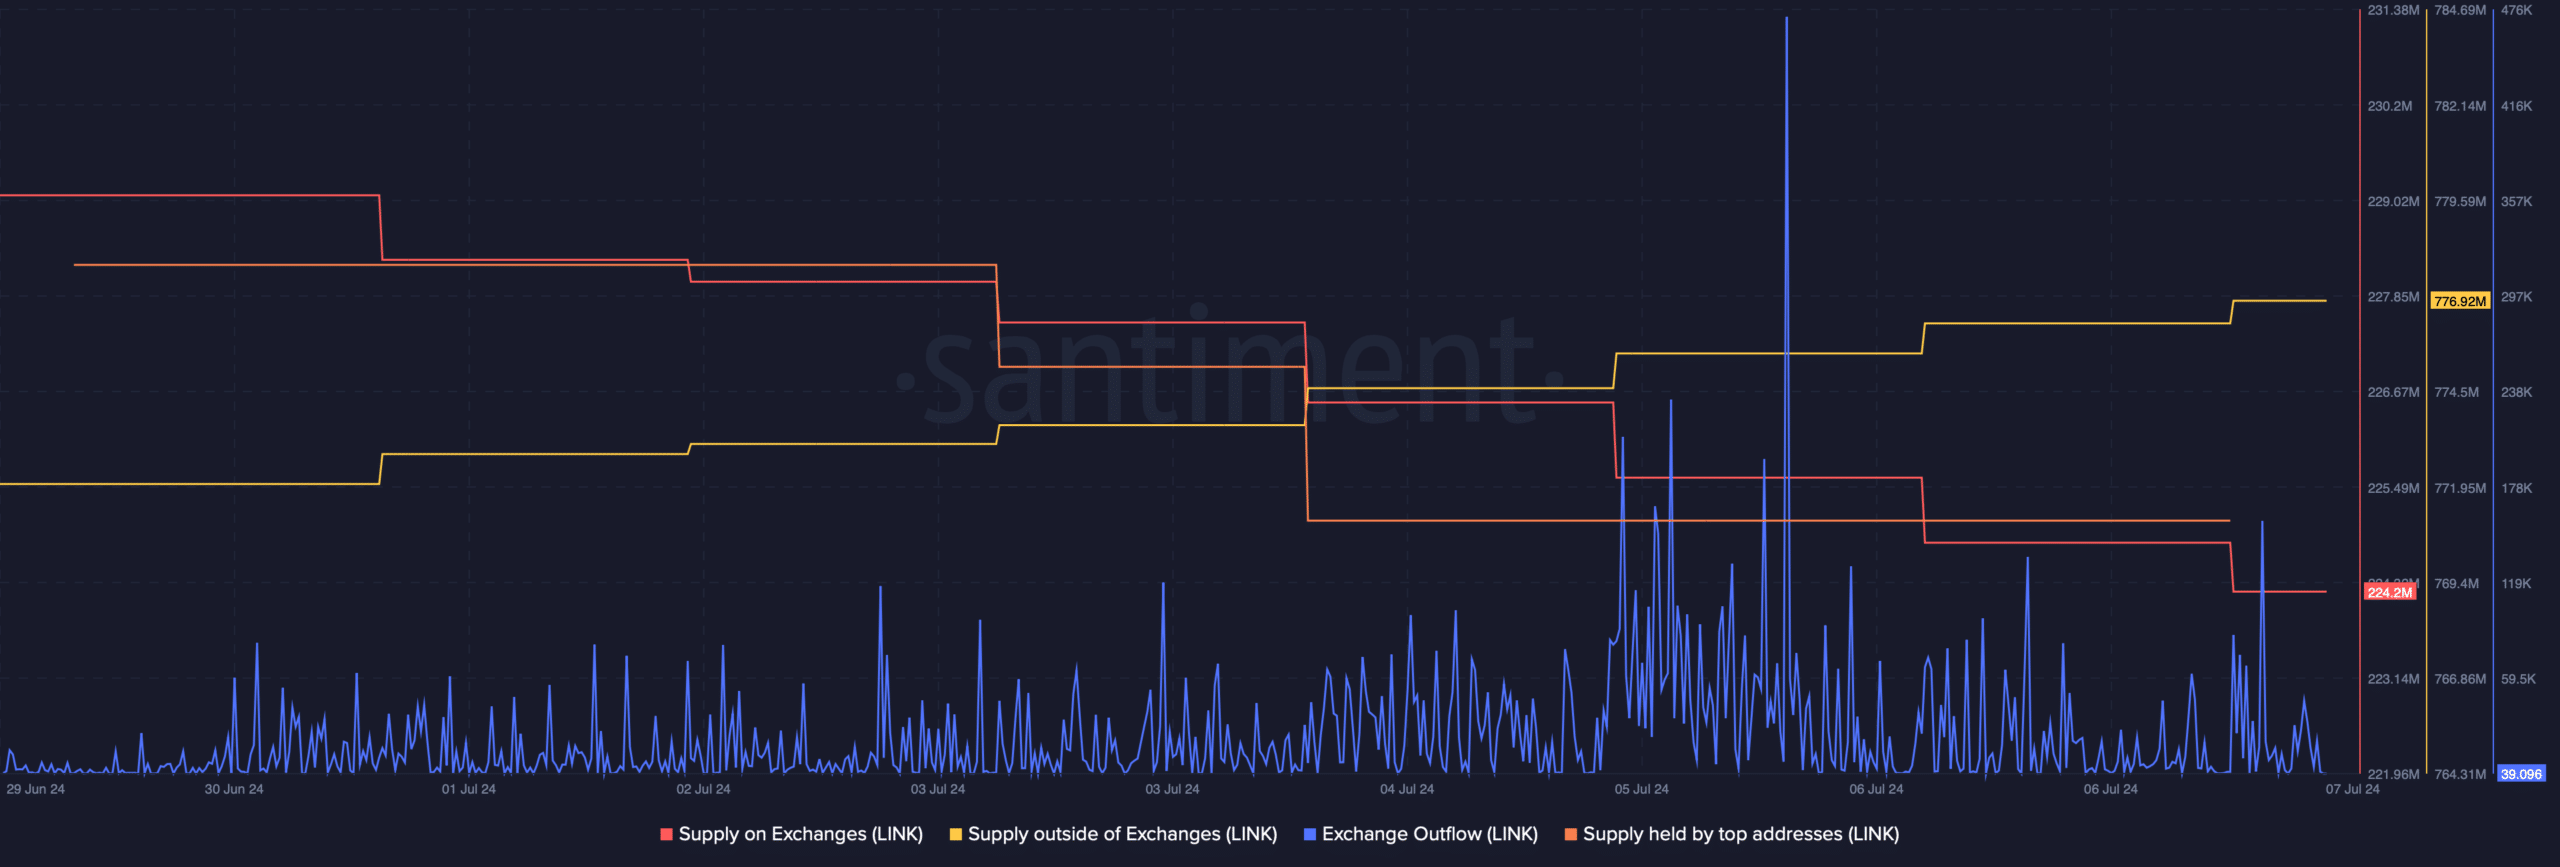
AMBCrypto’s analysis of Santiment’s data revealed that investors were still buying LINK, which is generally considered bullish. This seemed to be the case as LINK’s exchange outflow spiked a few days ago.
Additionally, its supply on exchanges dropped while its supply outside of exchanges increased, further proving that buying pressure was high.
Nonetheless, the whales didn’t have much confidence in LINK and sold the token as the supply held by top addresses dropped last week.
Apart from this, another positive metric was Chainlink’s fear and greed index. At press time, it had a value of 23%, meaning that the market was in a “fear” phase.
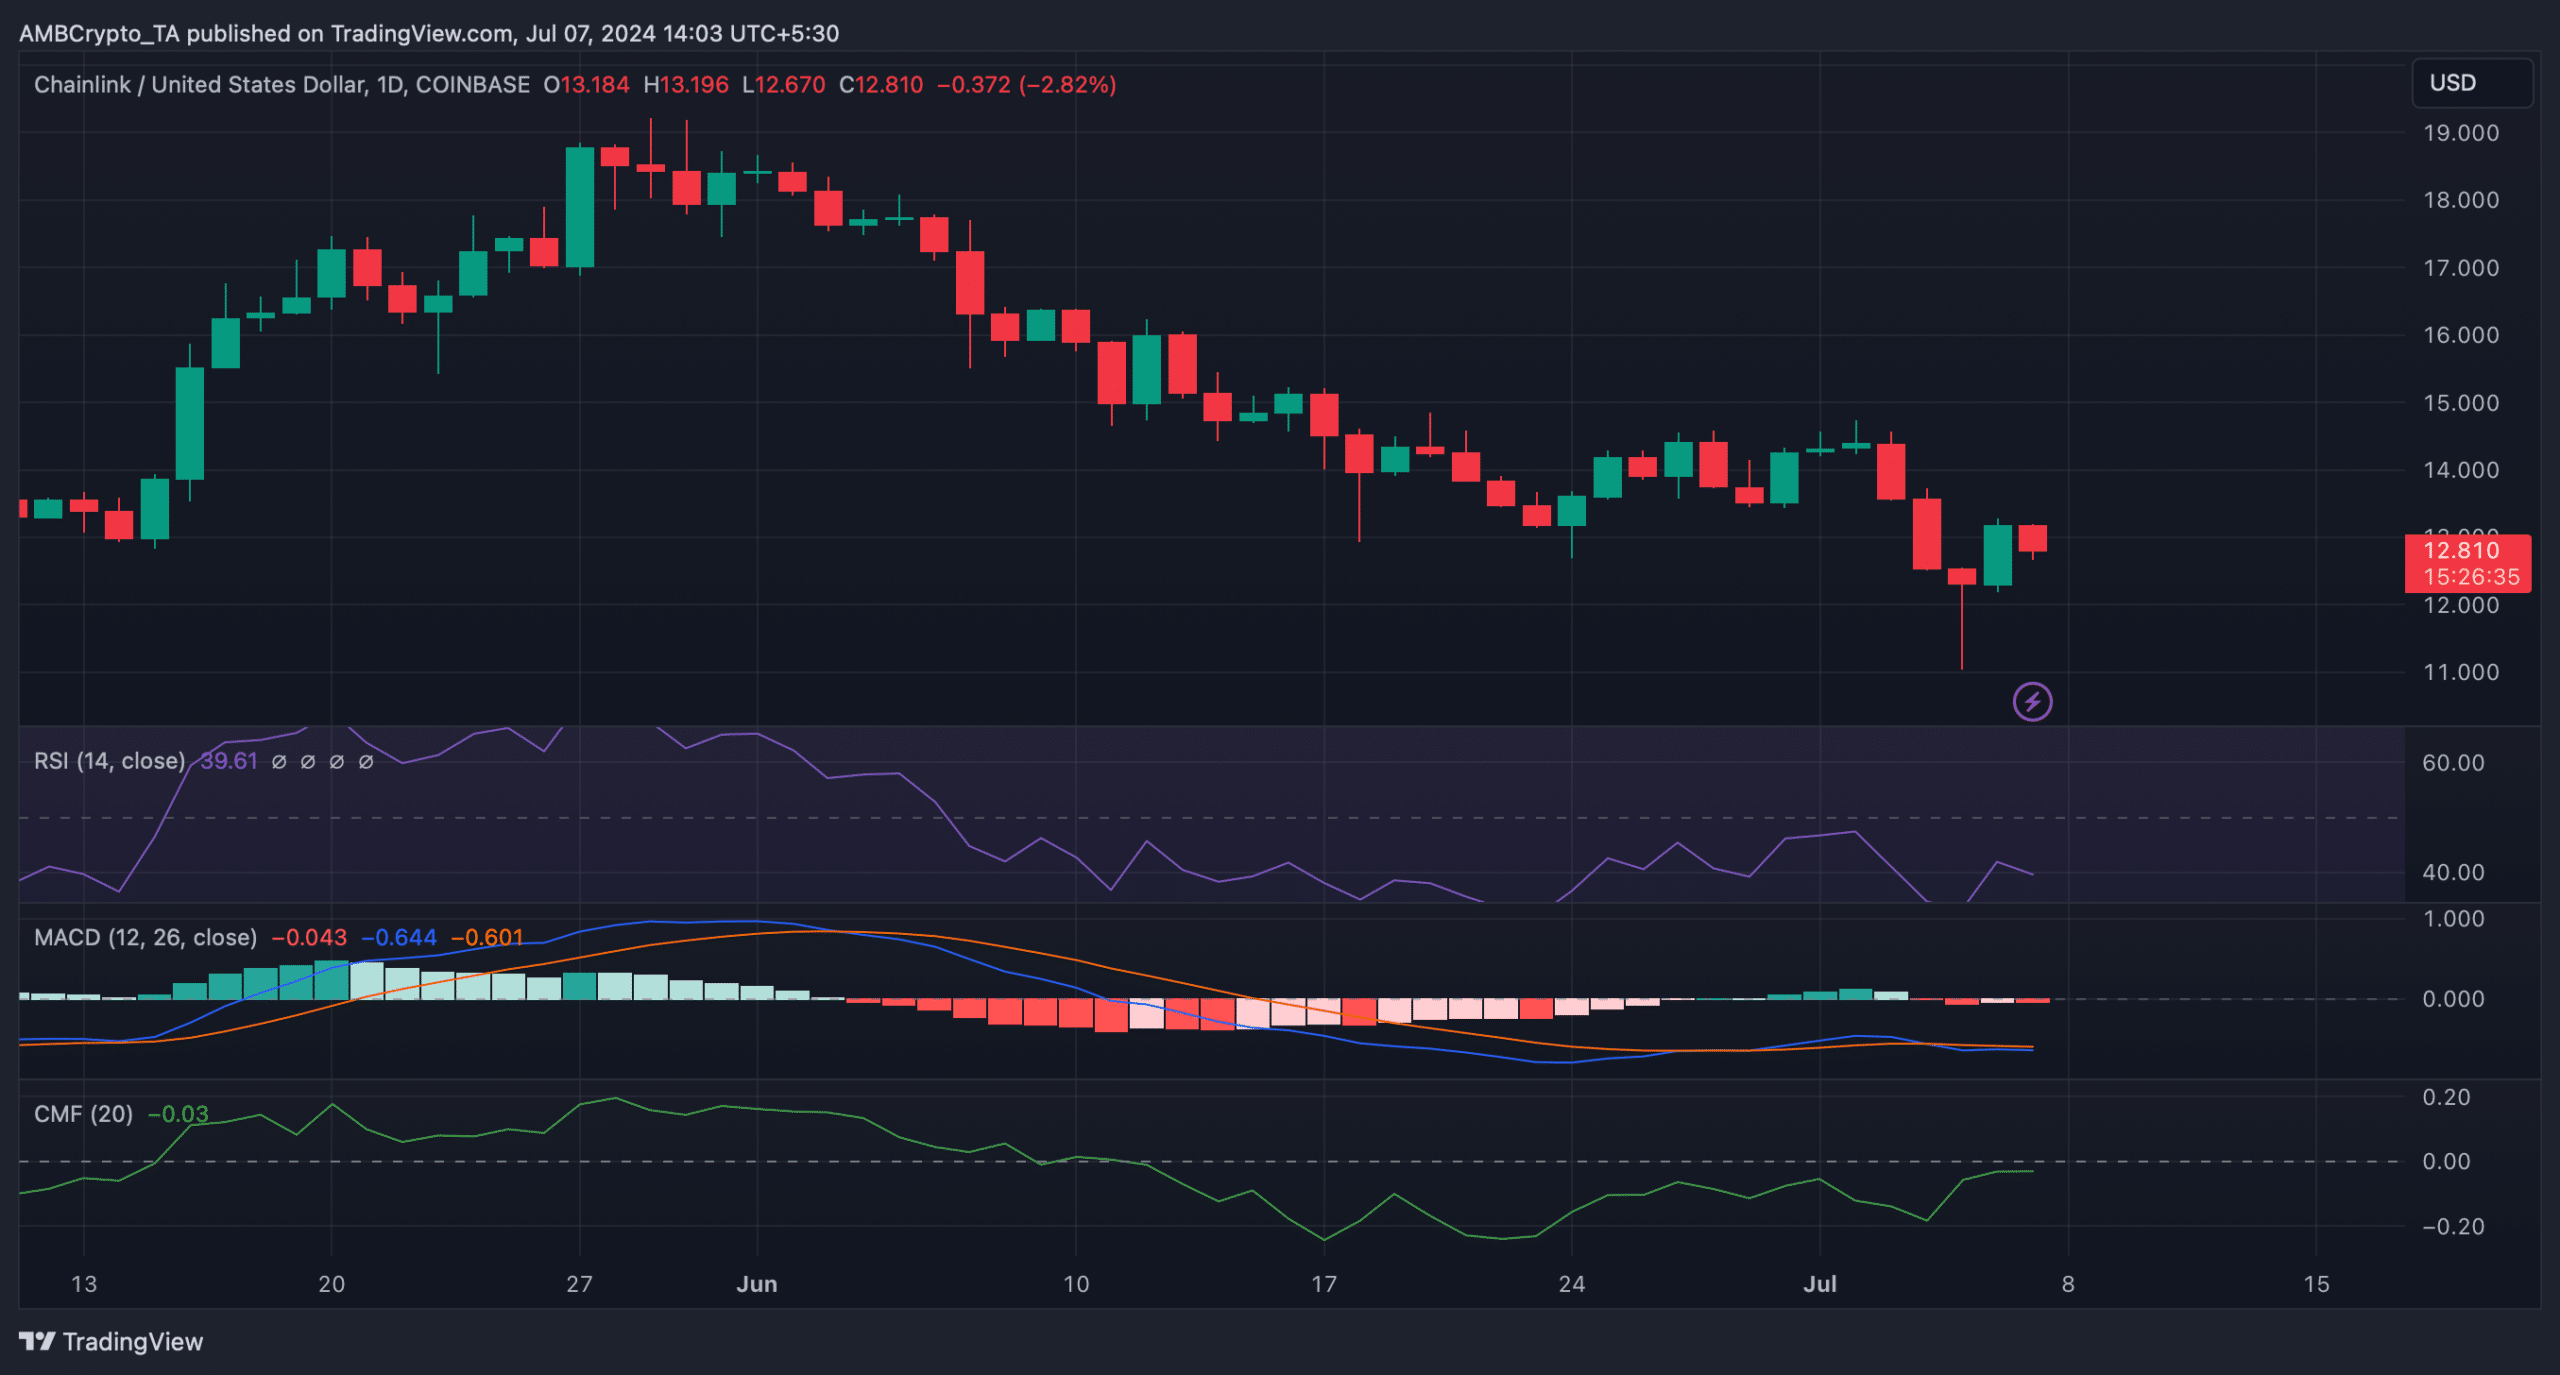
Whenever that happens, it indicates that the chances of a price increase are high. We then planned to have a look at the token’s daily chart.
However, the market indicators looked pretty bearish. For instance, the MACD displayed a bearish crossover. The Chaikin Money Flow (CMF) moved southward.
Moreover, the Relative Strength Index (RSI) also followed a similar trend, hinting at a price drop.
Realistic or not, here’s LINK’s market cap in BTC’s terms
As per our analysis of Hyblock Capital’s data, if the bears take over and paint LINK’s chart red, then it won’t be surprising to witness LINK dropping to $11.
To the contrary, if the bulls start to dominate, then investors might witness LINK touch $15 soon.