Chainlink, Crypto.com Coin, IOTA Price Analysis: 30 January

Chainlink traded close to the $22.24 support mark and flashed bearish signals at the time of writing. CRO moved below $0.06 support and the indicators suggested that it could topple yet another support level over the coming sessions. On the flip side, IOTA noted some bullish activity and looked to break above $0.51 resistance.
Chainlink [LINK]

Chainlink retested $22.24 support once again but the bulls prevented a downwards breakout on the charts. However, a move above the present channel was unlikely over the next few sessions as the trading volumes and buying activity was low. Since the candlesticks slipped below their 20-SMA (blue), some short term bearishness can be expected and the bears could target a move below $22.24 support.
The Awesome Oscillator slightly favored the selling side as the index was bearish-neutral and the On Balance Volume showed that buyer numbers were subdued. Although these were not the indications of a bearish reversal, it showed that the bullish cycle over the last 30 days was slowly losing some momentum.
Crypto.com Coin [CRO]
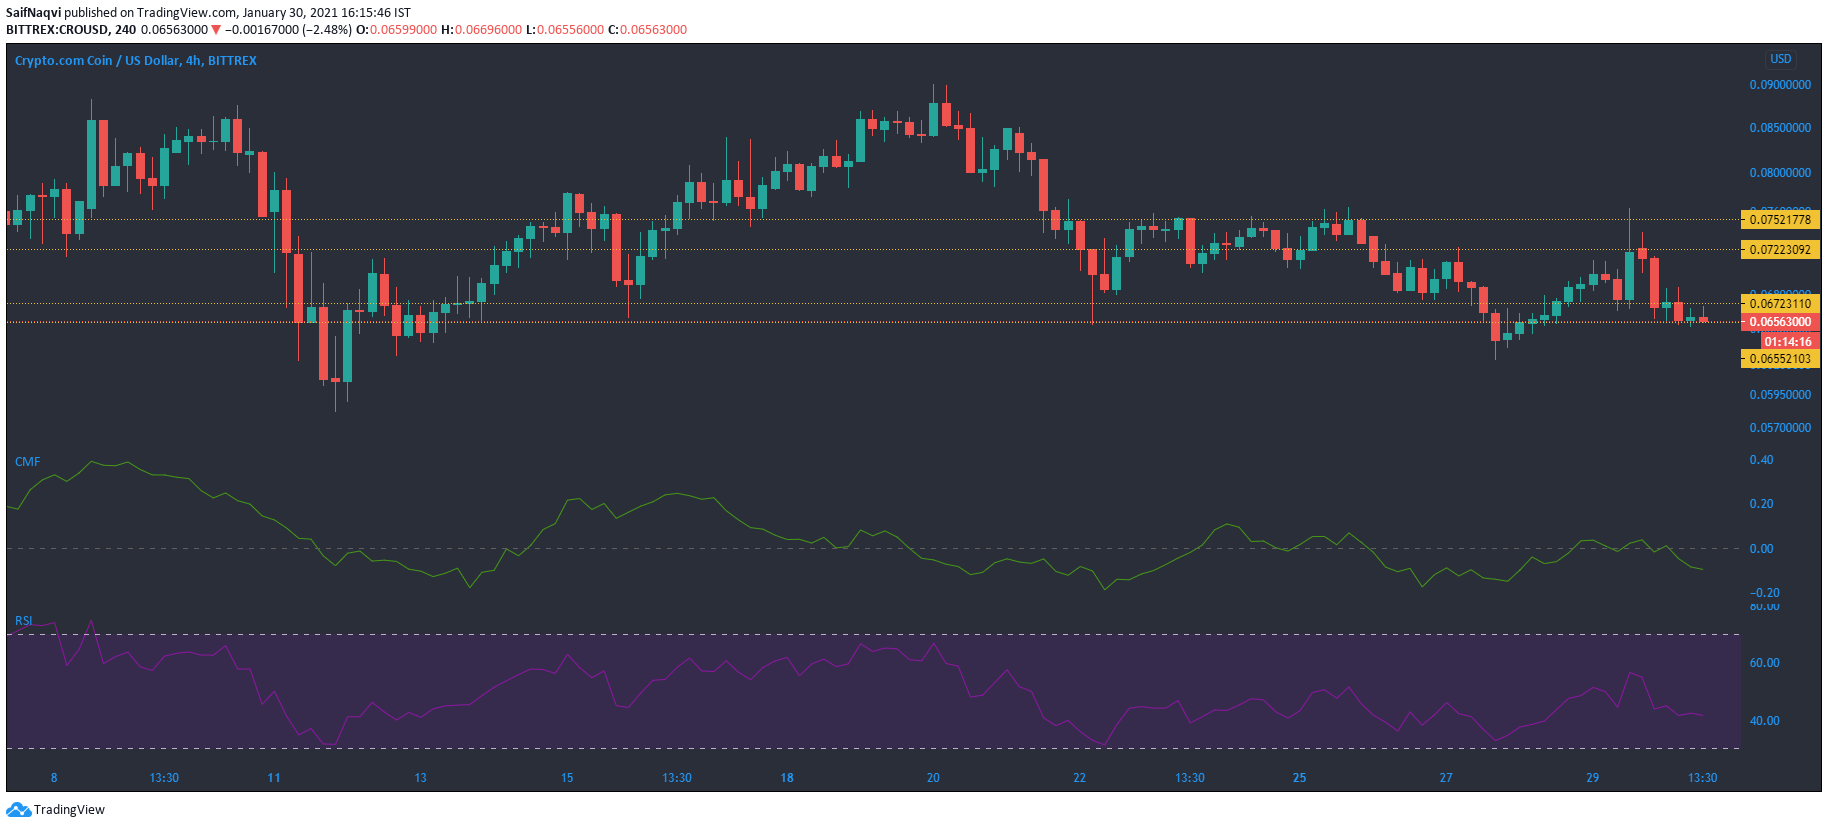
Crypto.com Coin flipped the $0.06 support level as the cryptocurrency shed 2.5% over the last 24 hours. The Chaikin Money Flow suggested that capital outflows pressurized CRO over the past few sessions, as the index fell in tandem with the price.
The Relative Strength Index also sided with the bears as the index pointed slightly lower from the neutral zone. Support at $0.065 could be toppled in an extended bearish scenario. On the other hand, a bullish outcome could see CRO break above its immediate resistance and head towards the $0.072 mark.
IOTA
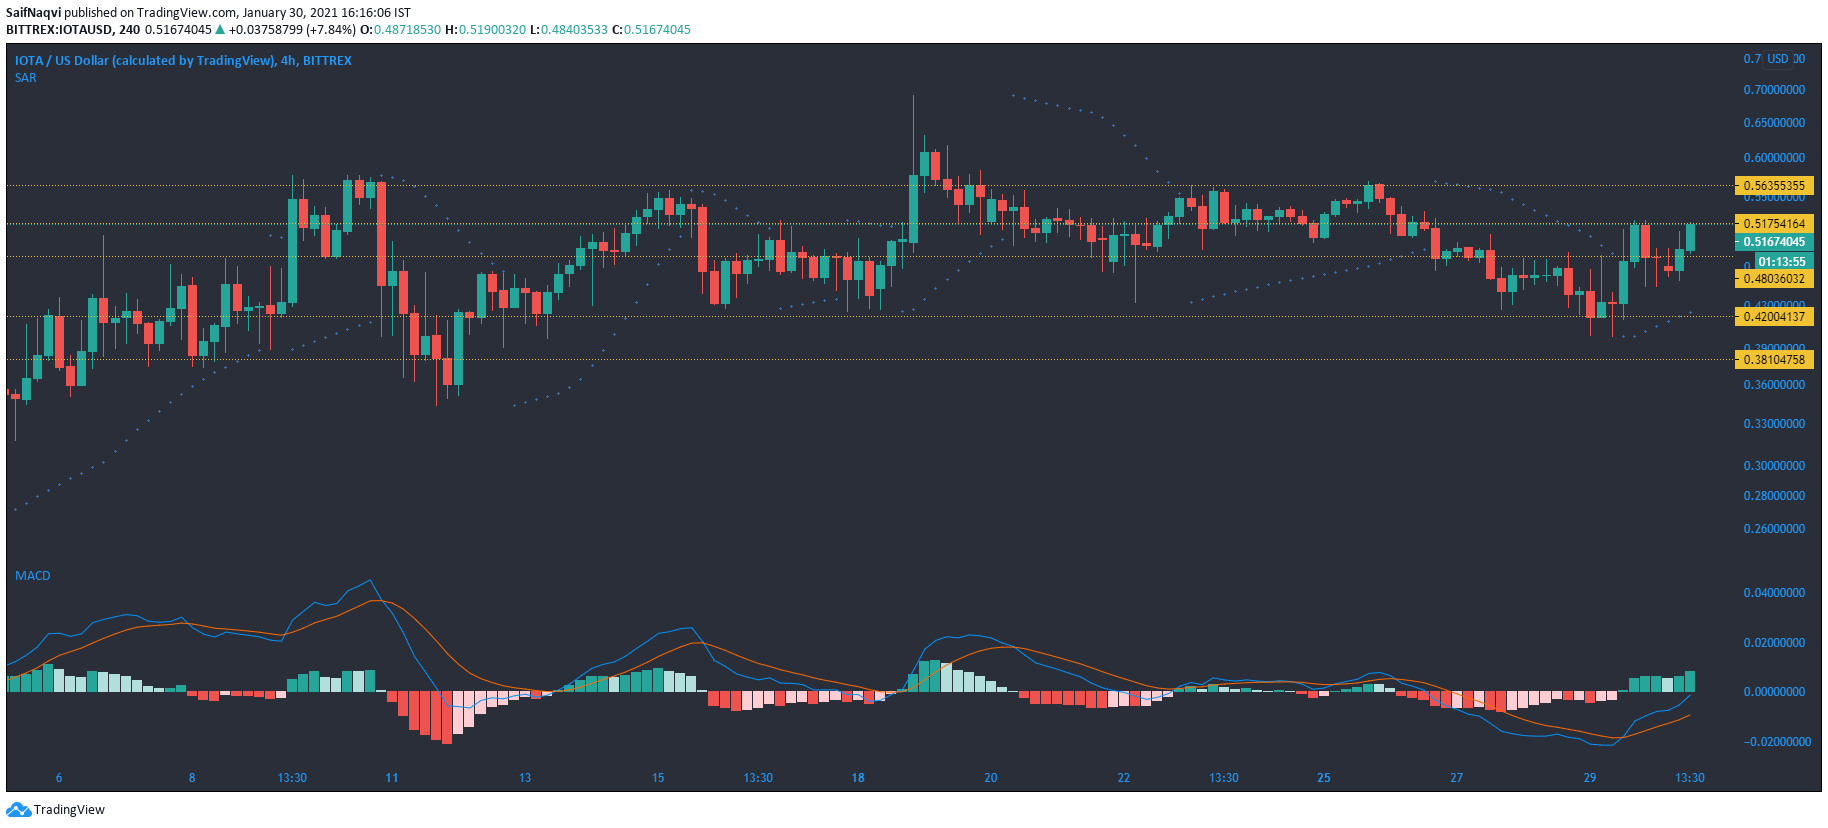
IOTA’s price retraced by over 11% in the past seven days but cut its losses at $0.420 support as the bulls stepped in to alleviate the selling pressure. At the time of writing, IOTA was in the green as the price retested $0.51 resistance. A move above the aforementioned resistance mark could indicate a short term bullish cycle.
The Parabolic SAR’s dotted markers were below the candlesticks, a sign that IOTA was in an uptrend. Lastly, the MACD showed that bullish momentum was on the up as the green bars rose above the half-line.
Conversely, a bearish downturn could see IOTA slip below $0.480 support.