


Disclaimer: The information presented does not constitute financial, investment, trading, or other types of advice and is solely the writer’s opinion.
- INK’s bearish slide briefly halted at the $5.94 support level.
- Spike in active deposits could lead to more selling pressure.
Chainlink [LINK] extended its bearish swing over the past 24 hours, with a 6.8% loss. This took the altcoin to the March low of $5.94. However, the price quickly bounced off the key support level and traded at $6.08, as of press time.
Realistic or not, here’s LINK’s market cap in BTC’s terms
LINK’s further dips could be associated with the general crypto market correction over the past 24 hours, as Bitcoin [BTC] dipped below $26k to erase its recent gains.
Short-term bearish superiority evident
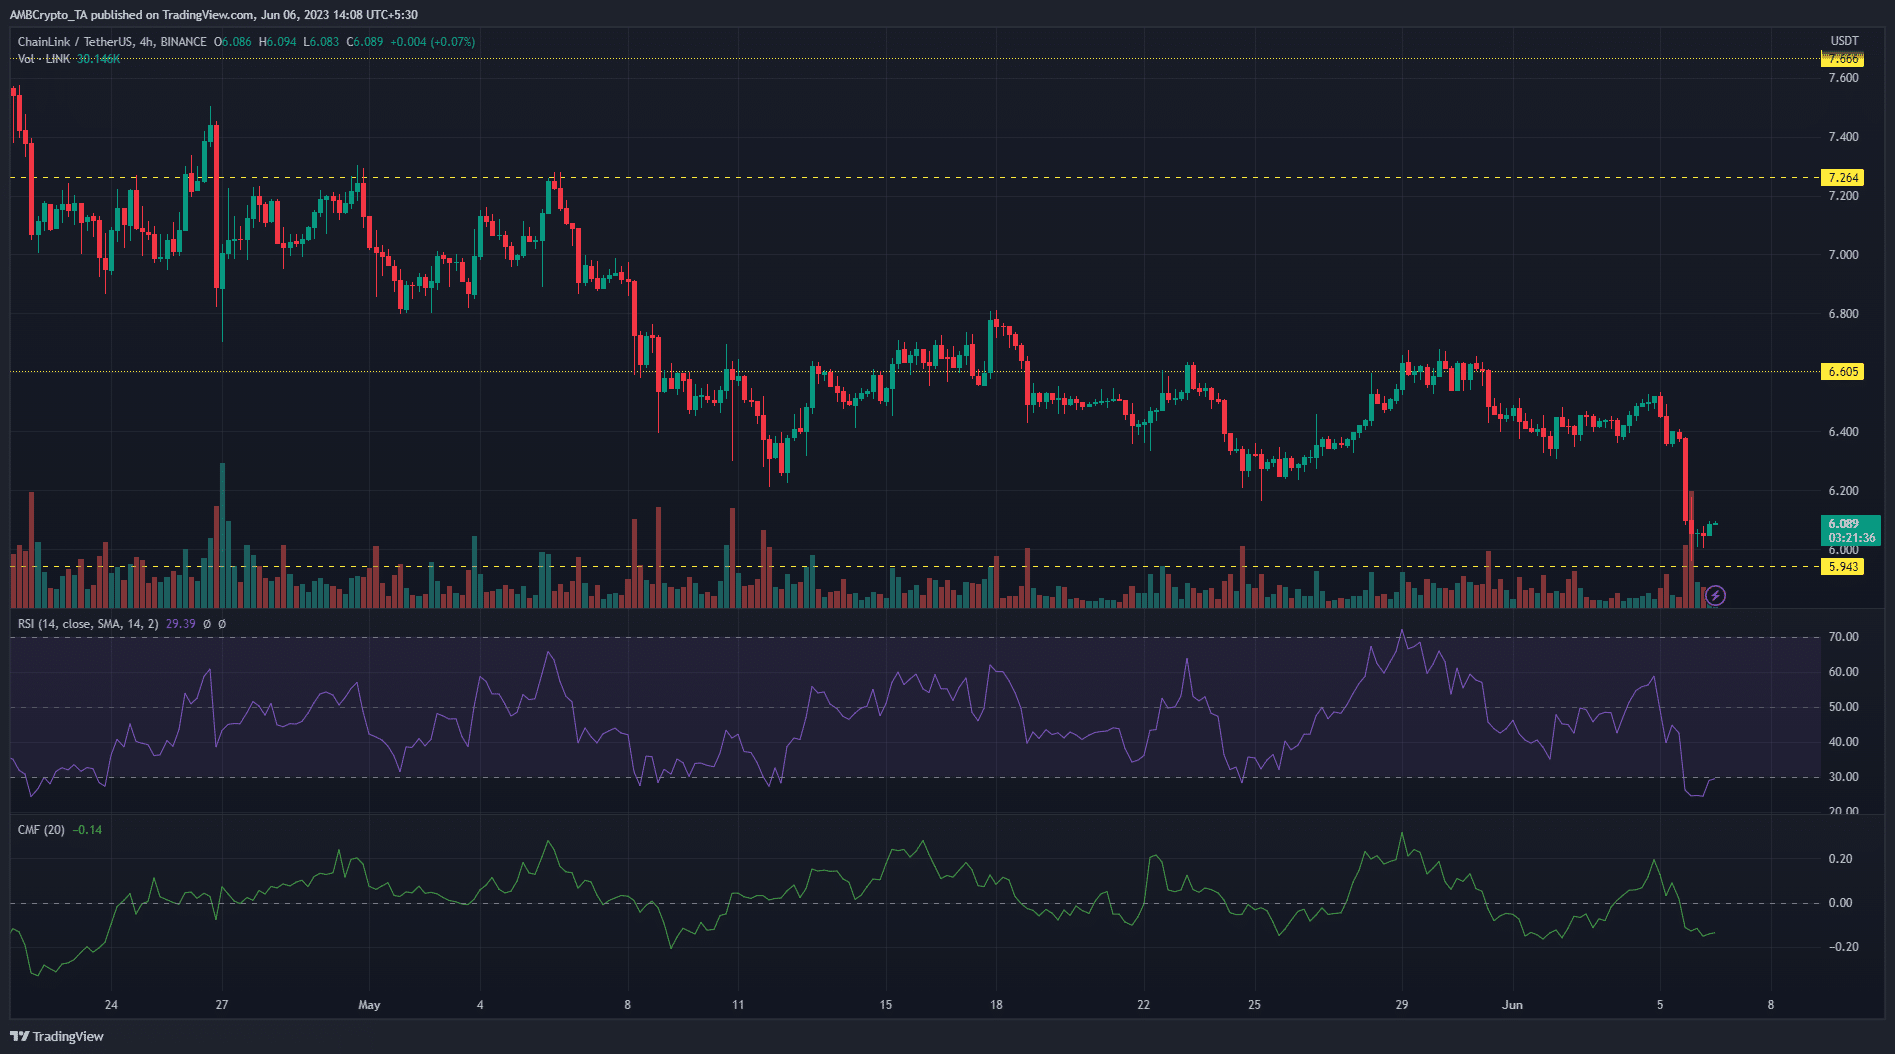
LINK’s market structure flipped bearish from mid-April after price was rejected at the $8.77 resistance level. A series of consecutive bearish candles on the higher timeframes saw the bearish swing smash through support levels at $7.66 and $7.26, respectively.
Bulls could briefly stem the bearish tide at the $6.60 support level. However, more selling pressure over the past week saw prices sink to the March low of $5.94. This was the first retest of this critical support level after it heralded the bullish rally that took LINK to its YTD-high of $8.77.
If bulls can successfully defend this support level, a rally back to the $6.60 level will be viable. On the other hand, a further break below the $5.94 support level, along with a session close under it, could see bears target the December 2022 low of $5.48.
Meanwhile, chart indicators on the four-hour timeframe highlighted the bearish superiority in the short term. The RSI dipped aggressively from the 60 mark over the past 48 hours and lay in the oversold zone with a reading of 29, as of the time of writing.
The CMF also revealed significant capital outflows and stood at -0.14.
Read Chainlink’s [LINK] Price Prediction 2023-24
Market speculators support more bearish activity
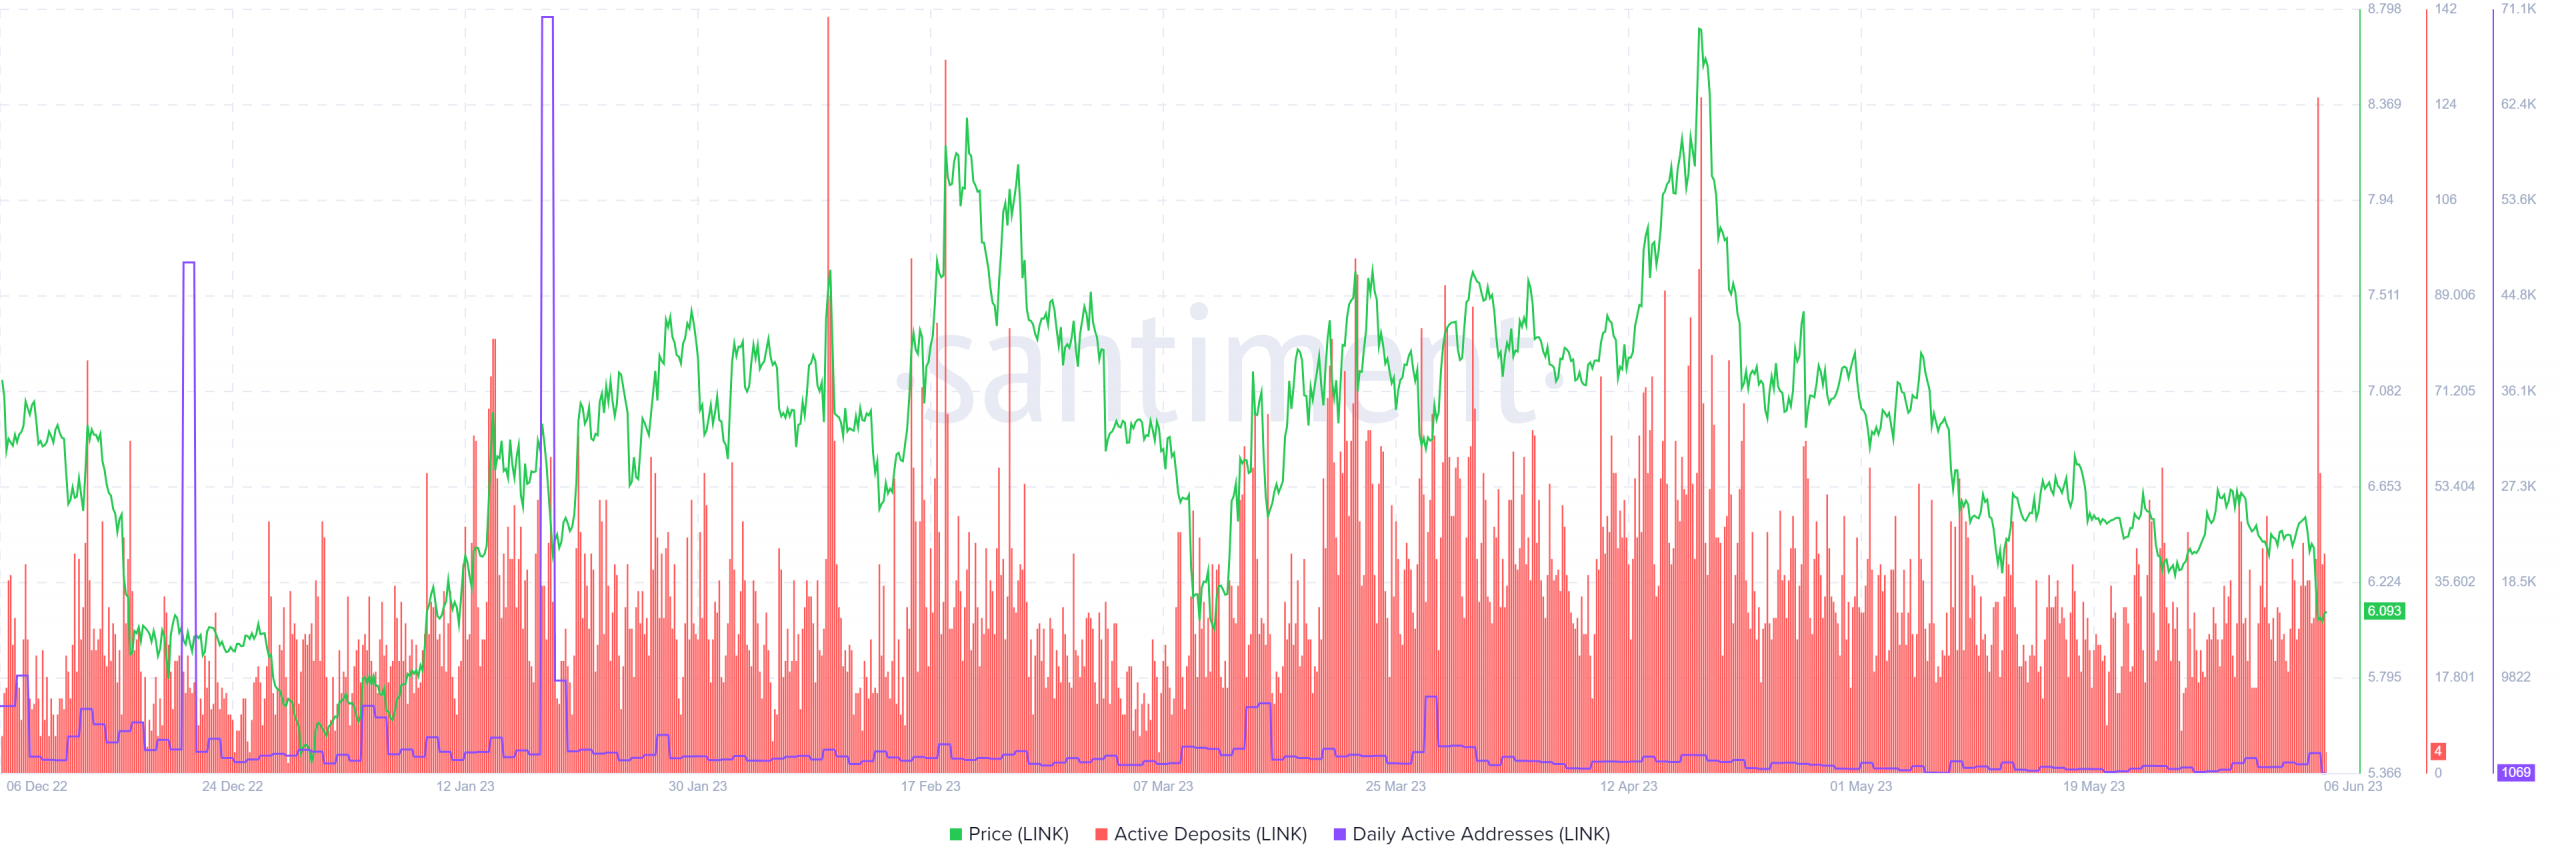
Data from Santiment showed that LINK experienced a huge spike in active deposits on 5 June. A historical look at active deposits for LINK showed that similar spikes led to significant price dips. This hinted at increased selling pressure in the short term.
The daily active addresses also showed a decline of almost 50% between 5 June and 6 June. This suggested further price drops might be imminent for LINK.