Chainlink investors should watch out for a bullish reaction at these levels

Disclaimer: The findings of the following analysis are the sole opinions of the writer and should not be considered investment advice
Chainlink did not see a strong bounce in recent hours, even as Bitcoin attempted to climb toward $42k. On higher timeframes, the price action of Chainlink has been bearish, although it did see respectable bullish moves as it bounced within a descending channel pattern. If Bitcoin faces another strong wave of selling, the fear in the crypto markets could accelerate LINK’s move southward.
LINK- 1 Day Chart
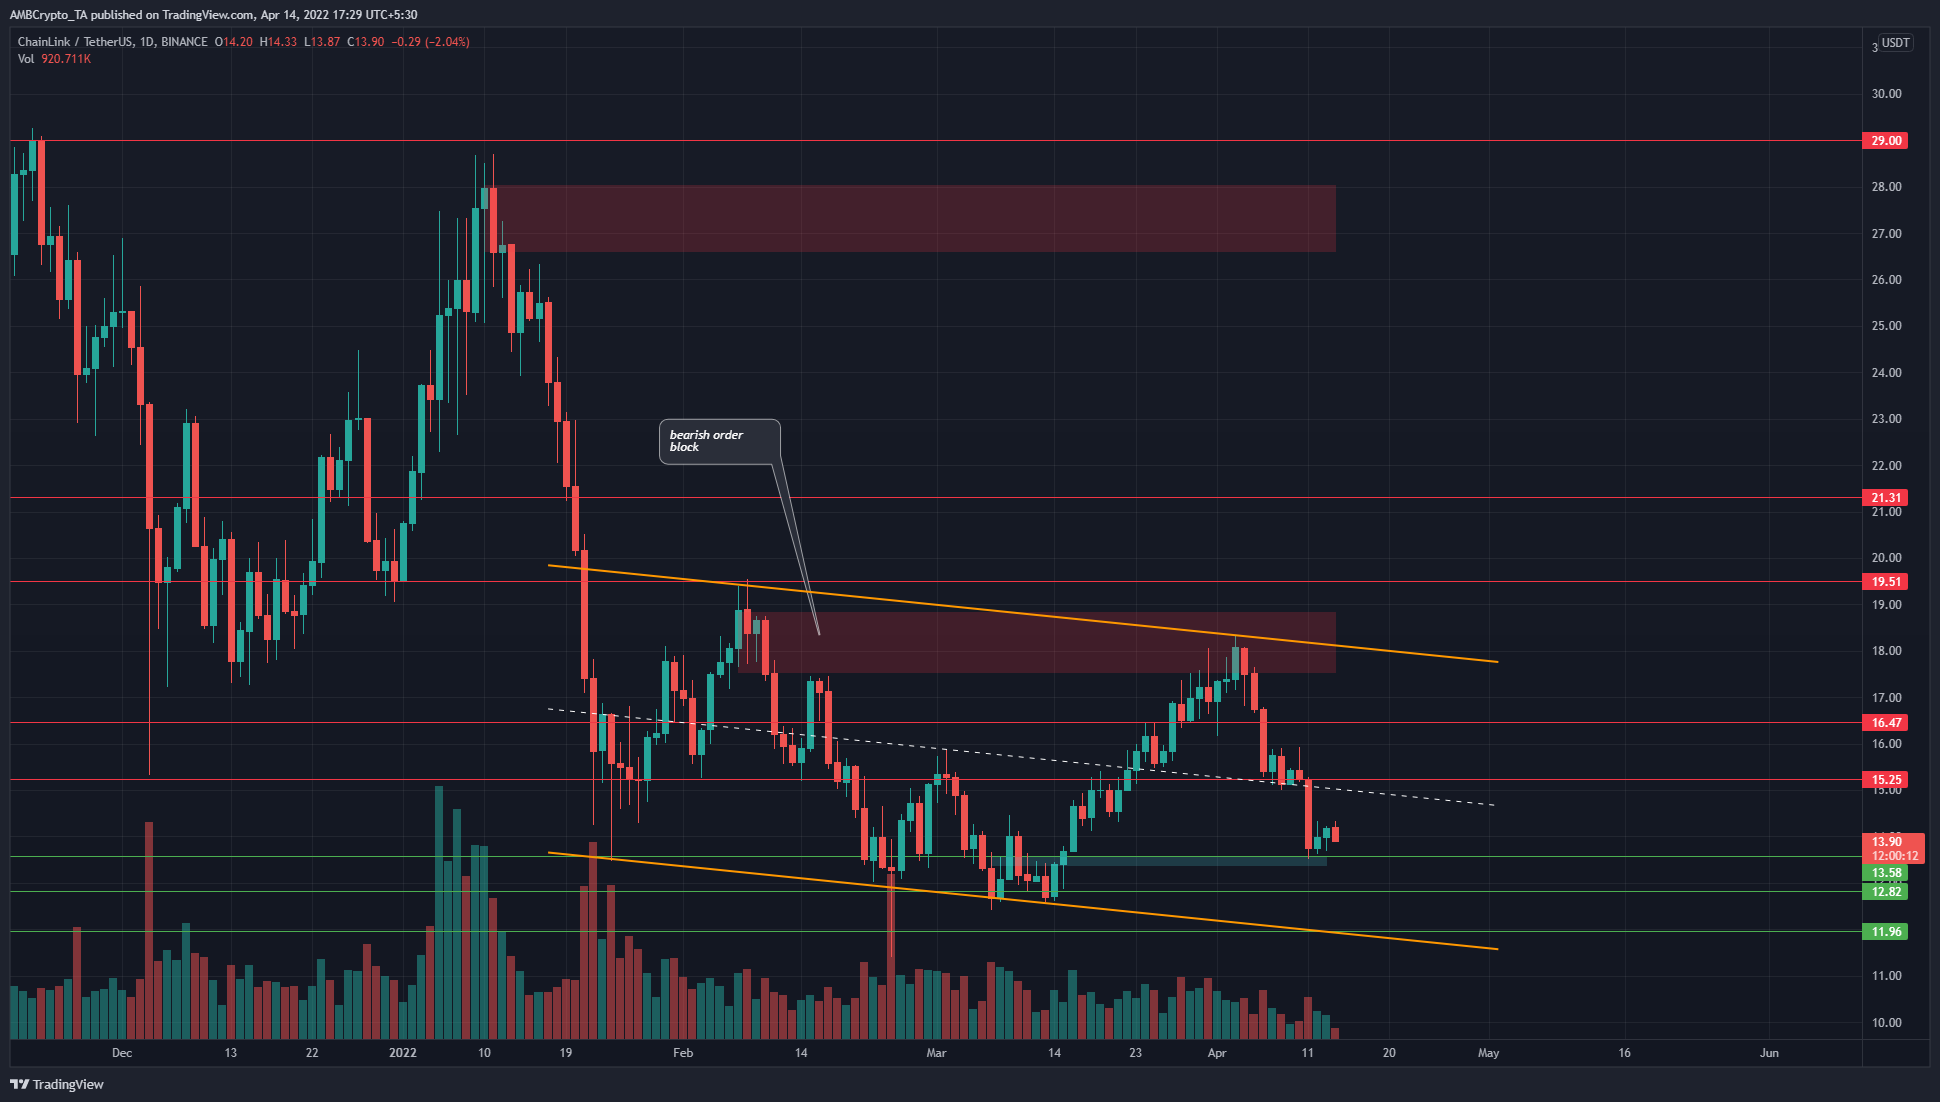
Chainlink has been in a downtrend since November when the price slipped beneath the $27 area. Since January, the price has been trading within a descending channel (orange). The mid-point of this channel (dashed white) has been respected as support and resistance within the same time period. This lends credibility to the channel pattern.
The market structure for LINK was bearish on the lower timeframes, as the price registered a series of lower highs and lower lows since the rejection at the $18 bearish order block last week. The price has also slipped beneath the mid-range, and a bearish retest of the same was possible.
There was a lower timeframe zone of demand at $13.4 which has already seen a minor bounce but might not hold back another wave of selling.
Rationale
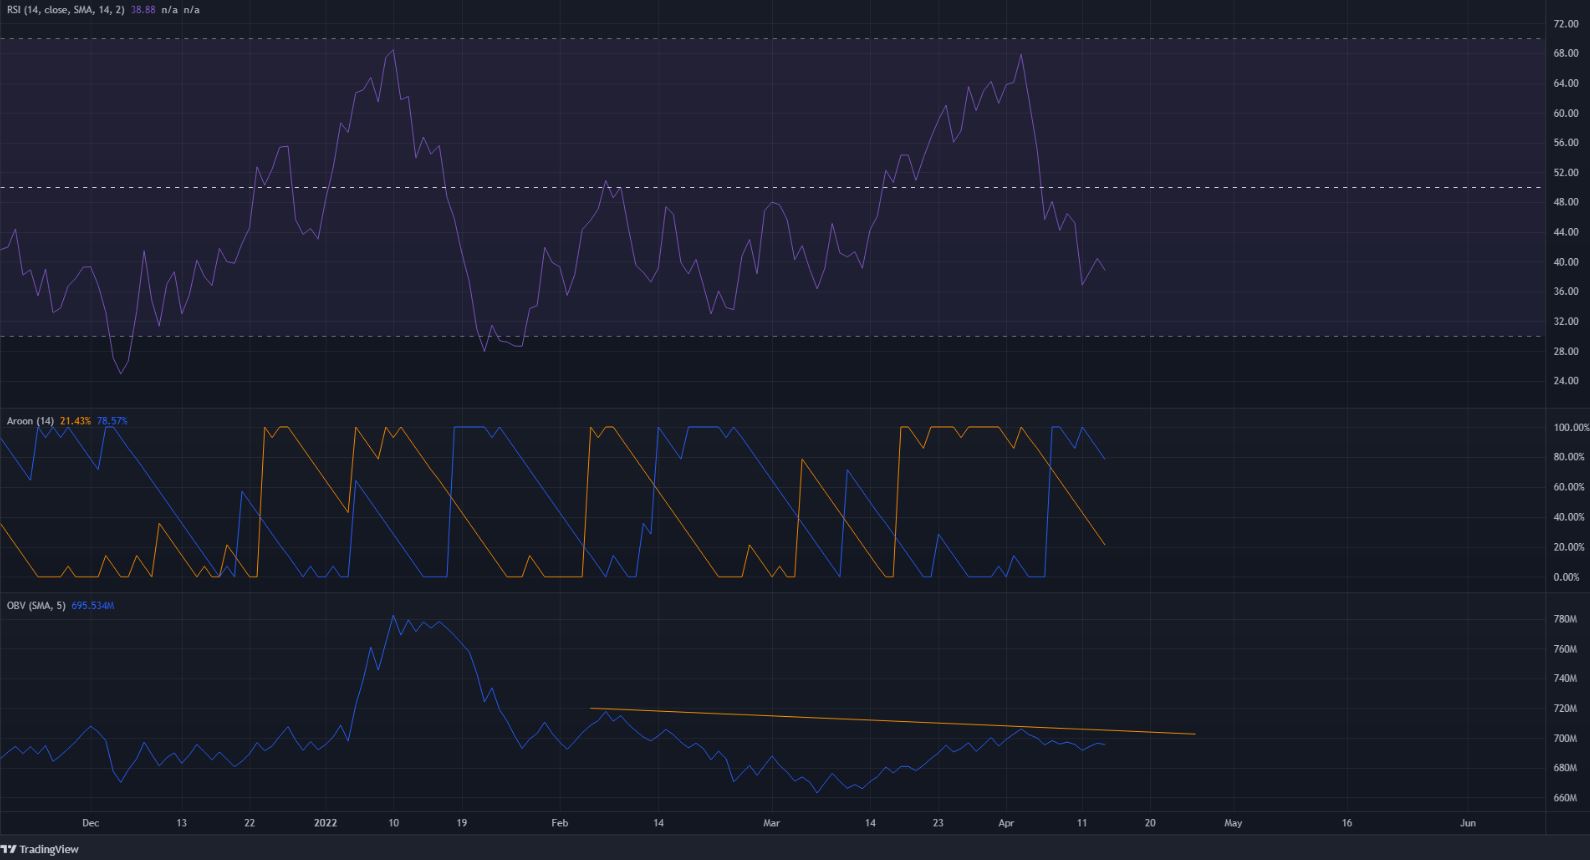
The RSI slipped beneath neutral 50 once more to stand at 38 and reflected the strong bearish momentum of the past few days. The Aroon Oscillator has done a decent job at reflecting the smaller trends within LINK’s bearish wave southward in recent months.
At the time of writing, the Aroon Down (blue) was above the Aroon Up (orange) once more, showing that another leg downward was initiated.
The OBV has also formed a lower high from February, alongside the price. Hence, the OBV and the price were in agreement.
Conclusion
The $18 bearish order block has rejected LINK bulls’ attempt to climb past it. Since then, the price has been on a strong downward move. In the next few weeks, it was likely that LINK would retest the $12 lows once more and bounce from the lows of the channel.


