
- Chainlink shows potential for a 40% rally, but breaking $13 resistance is crucial for the move.
- Large transactions spike while on-chain metrics reveal sustained accumulation of LINK over the past month.
Chainlink [LINK] was trading at $11.09 at press time, experiencing a 6.16% decline over the past 24 hours. The token has a circulating supply of 630 million LINK, giving it a market cap of approximately $6.95 billion.
Trading volume in the last 24 hours reached $594.2 million, indicating active trading despite the recent price drop.
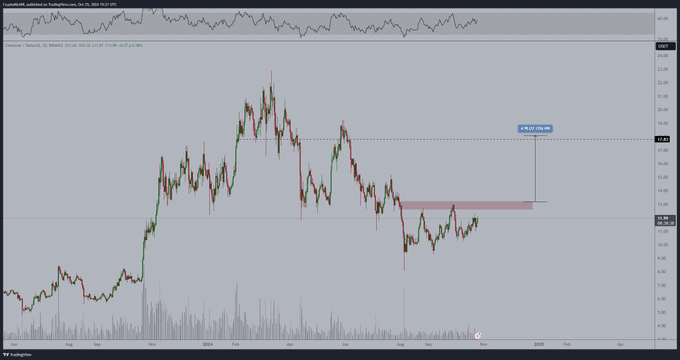
The current price movement comes after a period of consolidation in the $11-$12 range, following a downtrend. Analysts are closely watching the $13 resistance level, as it has repeatedly served as a key barrier. A break above this level could signal a bullish trend shift.
Potential breakout and key resistance
Michaël van de Poppe, a crypto analyst, maintains a bullish outlook on Chainlink. He expects a breakout within the next two weeks if LINK can overcome the $13 resistance. He describes this level as,
“the key to trigger further upward movement.”
Source: X
If LINK successfully breaks above $13, the price could potentially rally toward the $18 level, representing around a 40% gain from the breakout point. The Relative Strength Index (RSI) is currently in neutral territory, suggesting there is room for upward movement.
On-chain metrics: Large transactions surge
In the past 24 hours, 192 large transactions were recorded on the Chainlink network, matching the 7-day high reached on 25th October. This marks an increase from the 7-day low of 54 transactions on 19th October.
![]()
Source: IntoTheBlock
The surge in large transactions suggests heightened interest or significant capital movement among major holders.
In addition, the In/Out of the Money analysis shows that 37.51% of addresses (262.38k) are “in the money,” having purchased LINK at prices below $11.08. Meanwhile, 58.90% of addresses (411.97k) are “out of the money,” indicating they bought at higher prices.
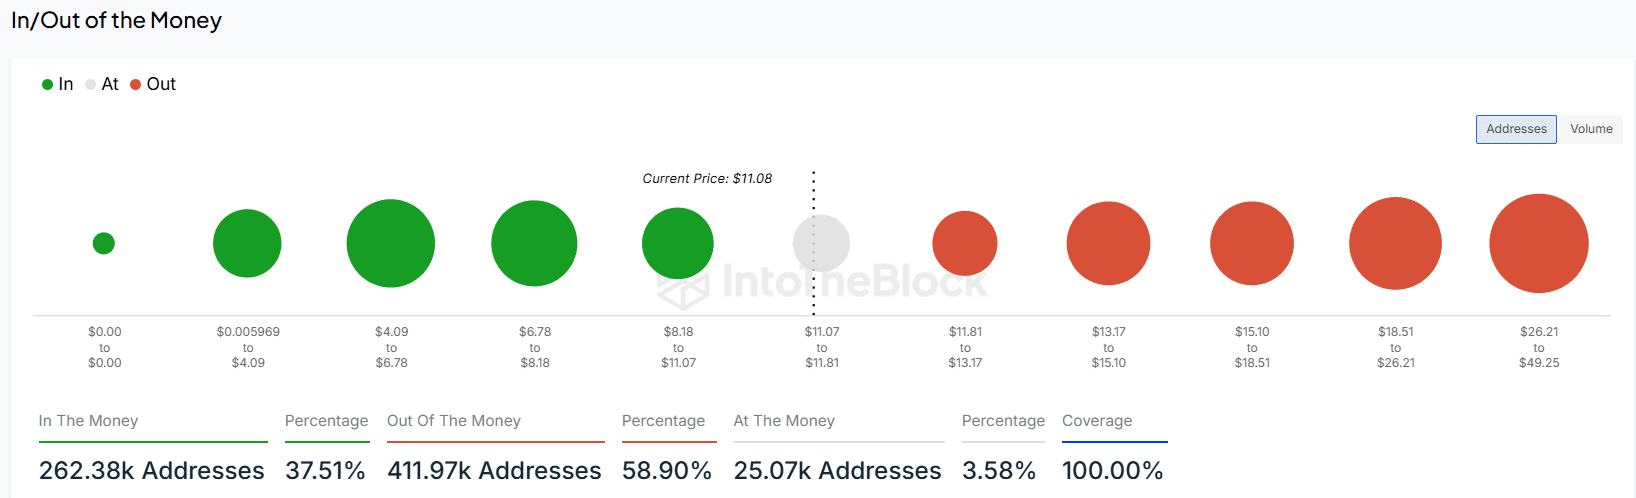
Source: IntoTheBlock
This could create stronger resistance if prices approach the $11.81-$13.17 range.
Exchange inflows and outflows
IntoTheBlock data from the past 24 hours reveals a net inflow of +105.43k LINK to exchanges, indicating potential short-term selling pressure. However, over the past week, a net outflow of -181.08k LINK suggests broader accumulation by holders.
Looking at the 30-day change, there has been a net outflow of -662.22k LINK, signaling sustained long-term accumulation trends.
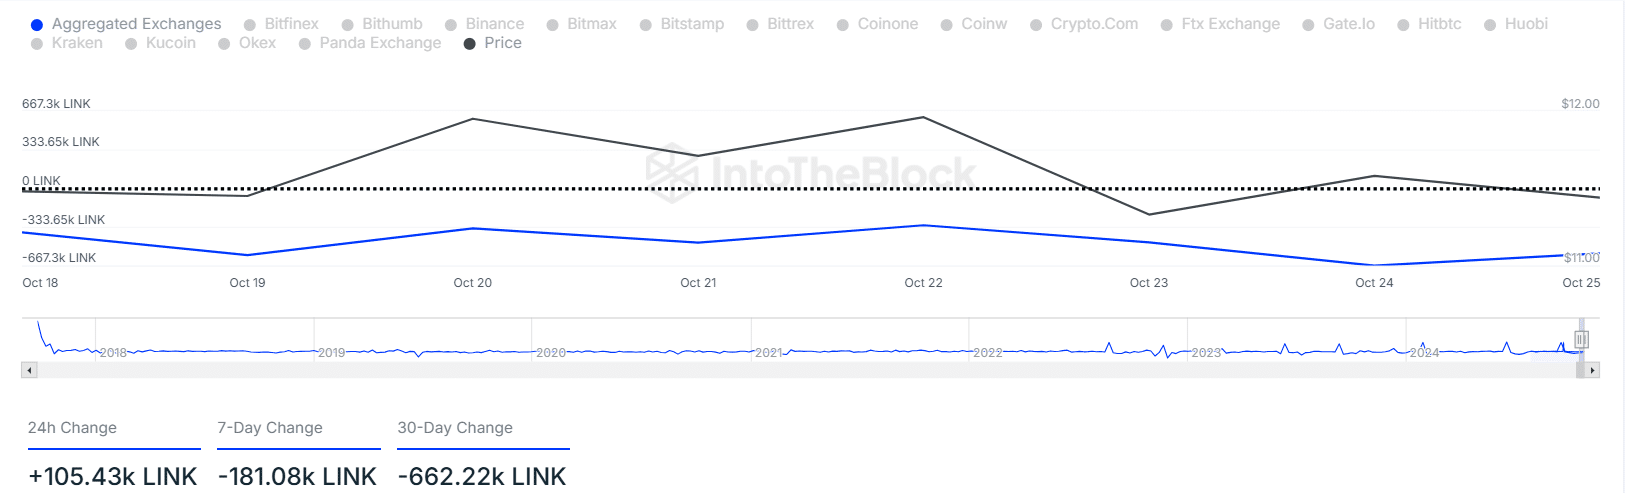
Source: IntoTheBlock
Is your portfolio green? Check out the LINK Profit Calculator
These inflow and outflow patterns point to possible short-term selling within a broader context of long-term accumulation.
The recent increase in exchange inflows could be a temporary reaction, while the larger outflows over the past month reflect confidence in LINK’s longer-term prospects.