Chainlink [LINK] hit $7.6 supply zone, will bears take control
![Chainlink [LINK] hit $7.6 supply zone, will bears take control](https://ambcrypto.com/wp-content/uploads/2023/03/image-1200x800-15.png)
Disclaimer: The information presented does not constitute financial, investment, trading, or other types of advice and is solely the writer’s opinion
- LINK was bullish on the 4-hour chart.
- But price action hit a confluence of supply zone and ascending trendline.
Chainlink [LINK] made an impressive recovery in the past few days. It surged from $6.895 but hit a confluence of key supply zone and ascending trendline that could delay further uptrend momentum.
However, Bitcoin [BTC] zoomed to $29K and retreated slightly despite the current FUD amidst heightened regulatory pressure in the United States. If bulls don’t exit their positions, BTC could retest the $29K and move upwards, pulling the rest of the altcoin market, including LINK.
Read Chainlink [LINK] Price Prediction 2023-24
Can bulls overcome the stiff resistance near $7.6?
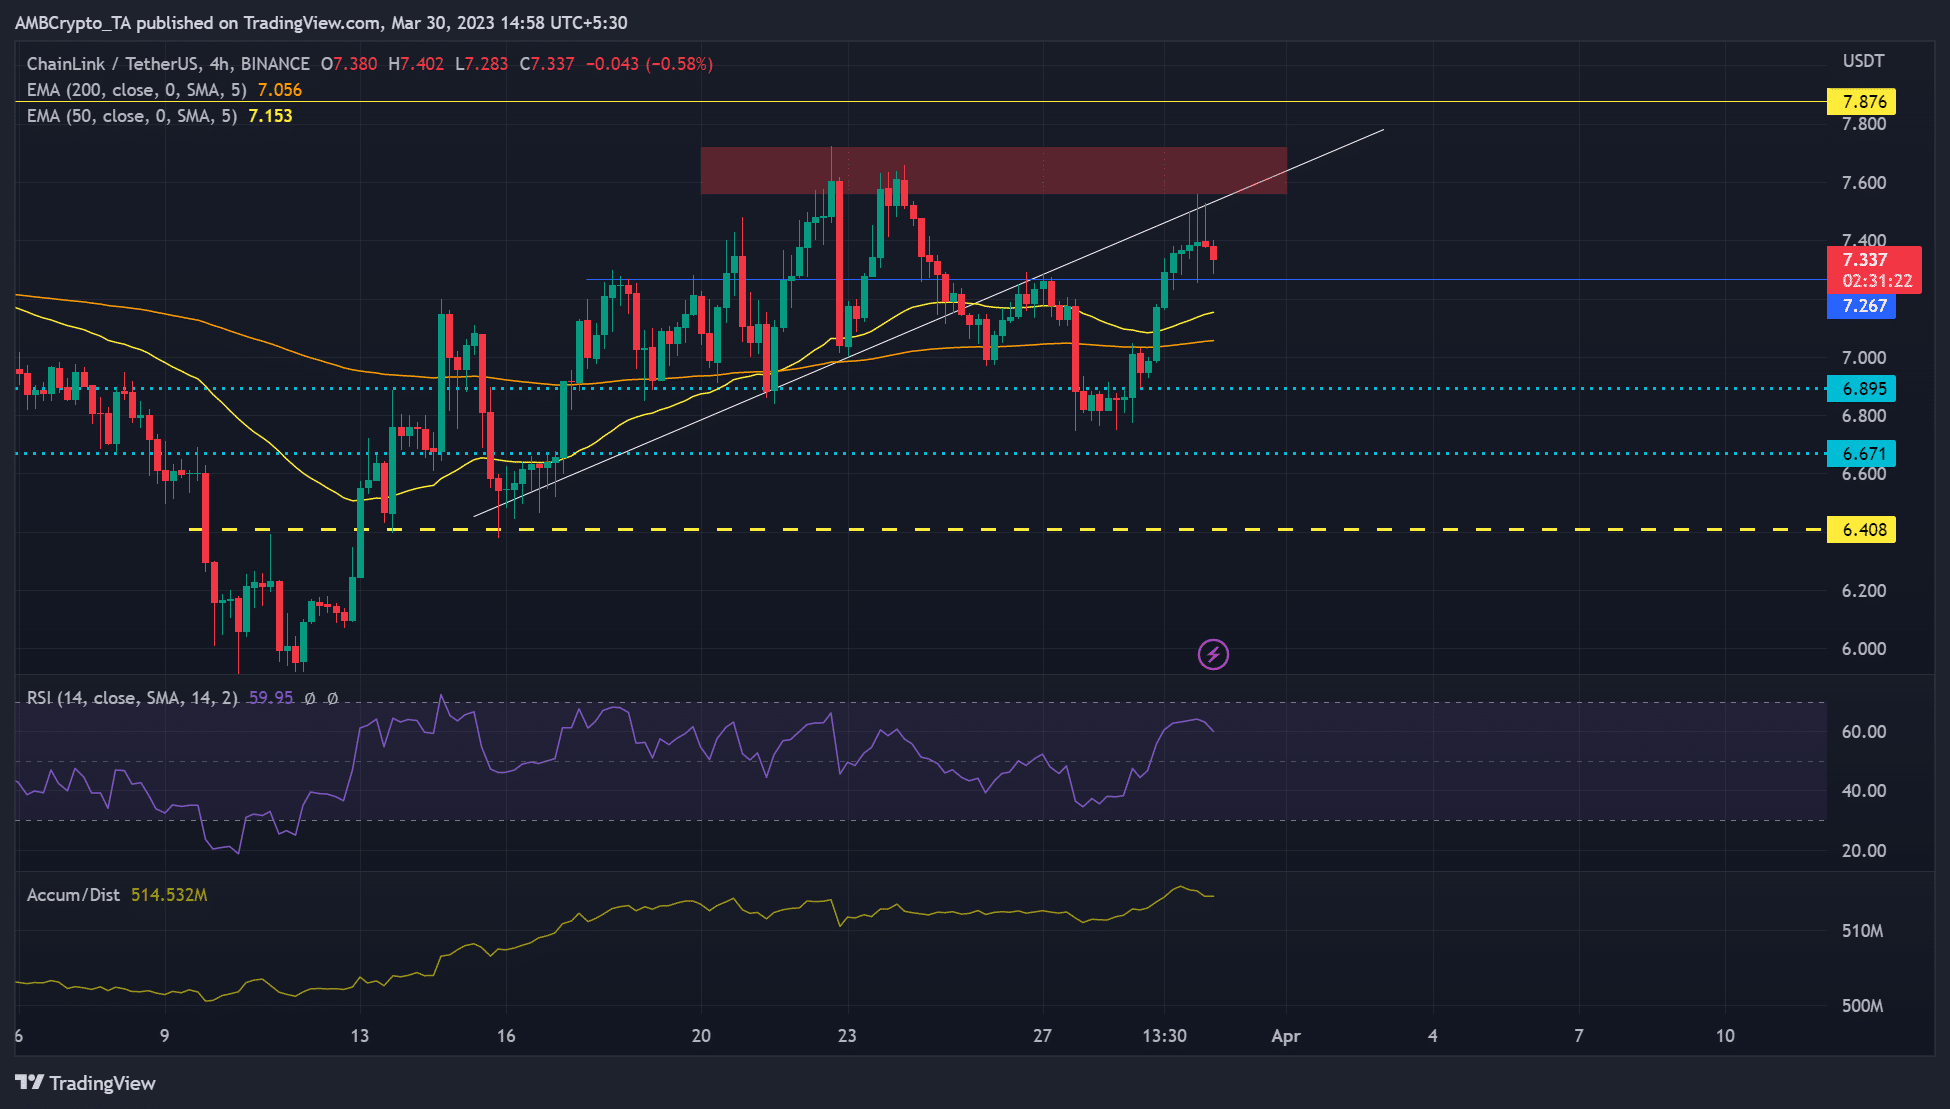
LINK has seen two price rejections at the supply zone of $7.6 in the past few days. At press time, the price action hit the same supply zone but closed below the ascending trendline, which attracted bears. However, bears must be cautious of the $7.27 support should bulls fail to exit their positions, especially if BTC rebounds to $29K.
If bulls close above the ascending trendline and the supply zone of $7.6, LINK could appreciate to $7.876. However, bulls must defend the $7.27 support to block bears from denting the bullish sentiment.
A close below $7.27 could energize near-term bears to sink LINK to 200 EMA ($7.056) or 50 EMA ($7.153). A retest of $6.895 could be likely if bears clear the hurdles at 200 and 50 EMAs.
But the price action was above 200 and 50 EMAs, showing a bullish LINK. Similarly, the RSI’s value at press time was 59, showing bulls still had leverage in the market.
Moreover, the accumulation/distribution indicator retreated but was almost pivoting to the upside at the time of writing. It shows bulls weren’t exiting the market – evidence of bullish sentiment.
Long/short ratio favored bears
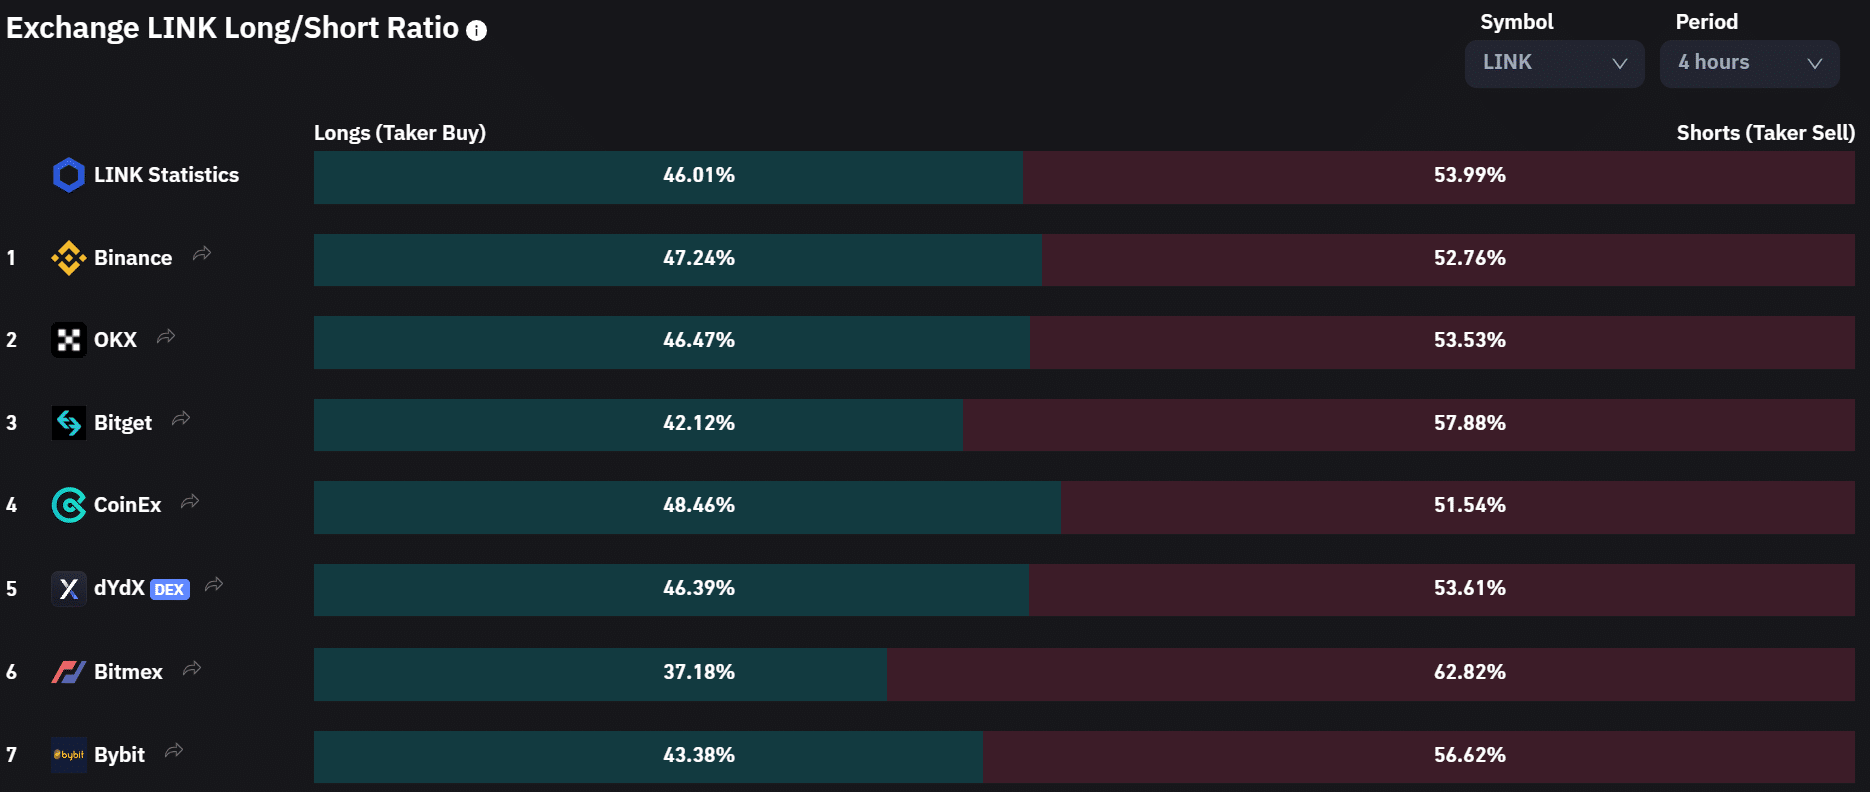
Despite the bullish price 4-hour chart at press time, the long/short ratio showed investors were bearish on the asset in the short/medium term. The pessimistic outlook could tip bears to breach the $7.27 support.
Is your portfolio green? Check out the LINK Profit Calculator
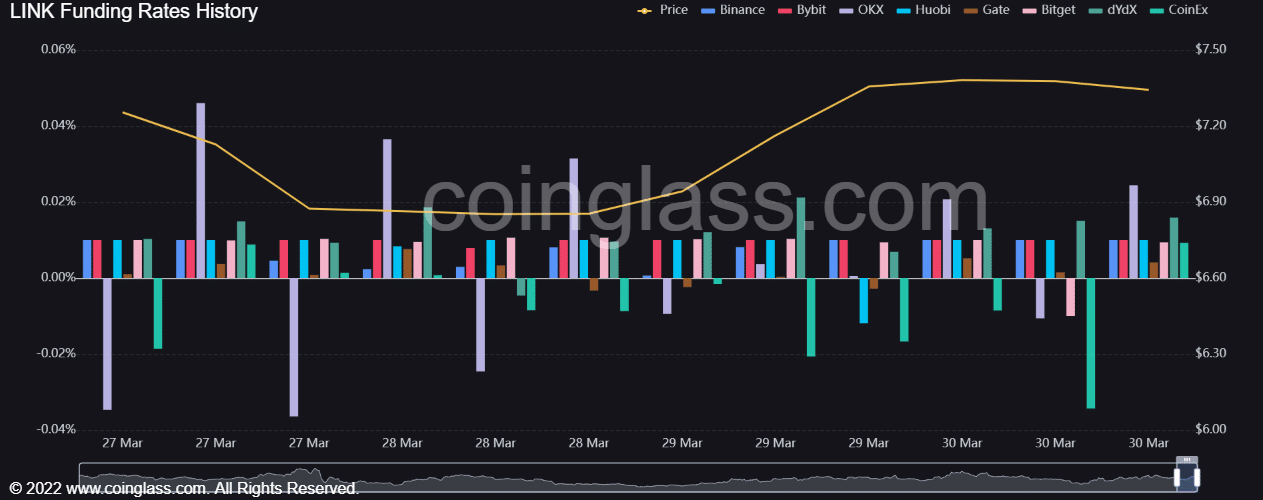
On the other hand, the funding rate history has been predominantly positive since 27 March. It shows bullish sentiment in the derivatives market. The conflicting metrics could undermine quality trades; investors should track BTC price action to make more profitable moves.