ChainLink

Chainlink [LINK] poised for breakout? Here are the signs which say yes…!
Posted:
Journalist
![Chainlink [LINK] poised for breakout? Here are the signs which say yes...!](https://ambcrypto.com/wp-content/uploads/2024/08/LINK-1200x686.webp)
- LINK bounced off a critical support level after holding for years
- RSI heatmap revealed lowest average as sector performance underlined bullish sentiment
Chainlink [LINK], at press time, seemed to be rebounding from a critical support and resistance level on the charts – One that it held for years.
A successful retest of this zone could pave the way for LINK to hit new highs in the coming months.
Buying near the $12.71 zone looked promising due to a key support level there. In fact, just recently, the price hit the golden zone around $9.8. This could signal a bullish continuation if $12.71 is reclaimed as support.
However, there’s a possibility of a further dip to complete a bearish pattern. If $9.39 is breached this week, another test of the golden zone may happen.
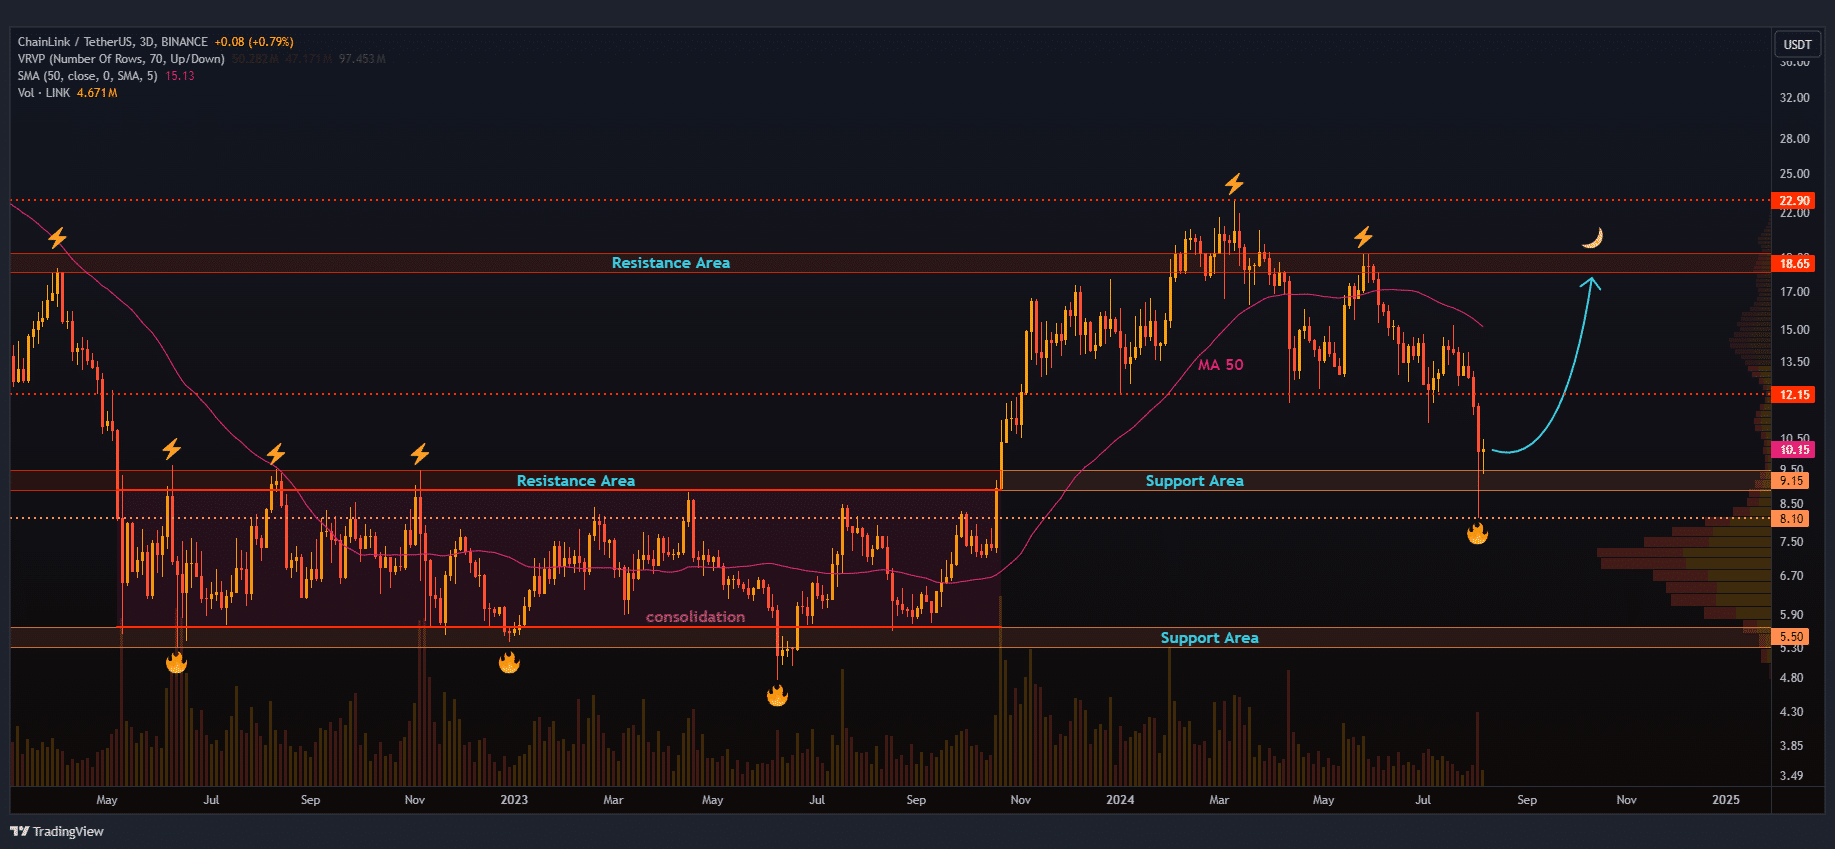
Source: LINK/USD, TradingView
HTF demand zone for altcoins
Altcoins have been recovering strongly lately, with several showing major gains for the week. Alongside BTC closing above $60K and ETH holding steady, this could signal the beginning of a bull cycle.
Altcoins have bounced back after rejecting a key support zone on their charts, suggesting that they might be poised for further gains too
Keeping an eye on LINK is crucial, as it could perform exceptionally well in the coming months due to its role in decentralized data management.
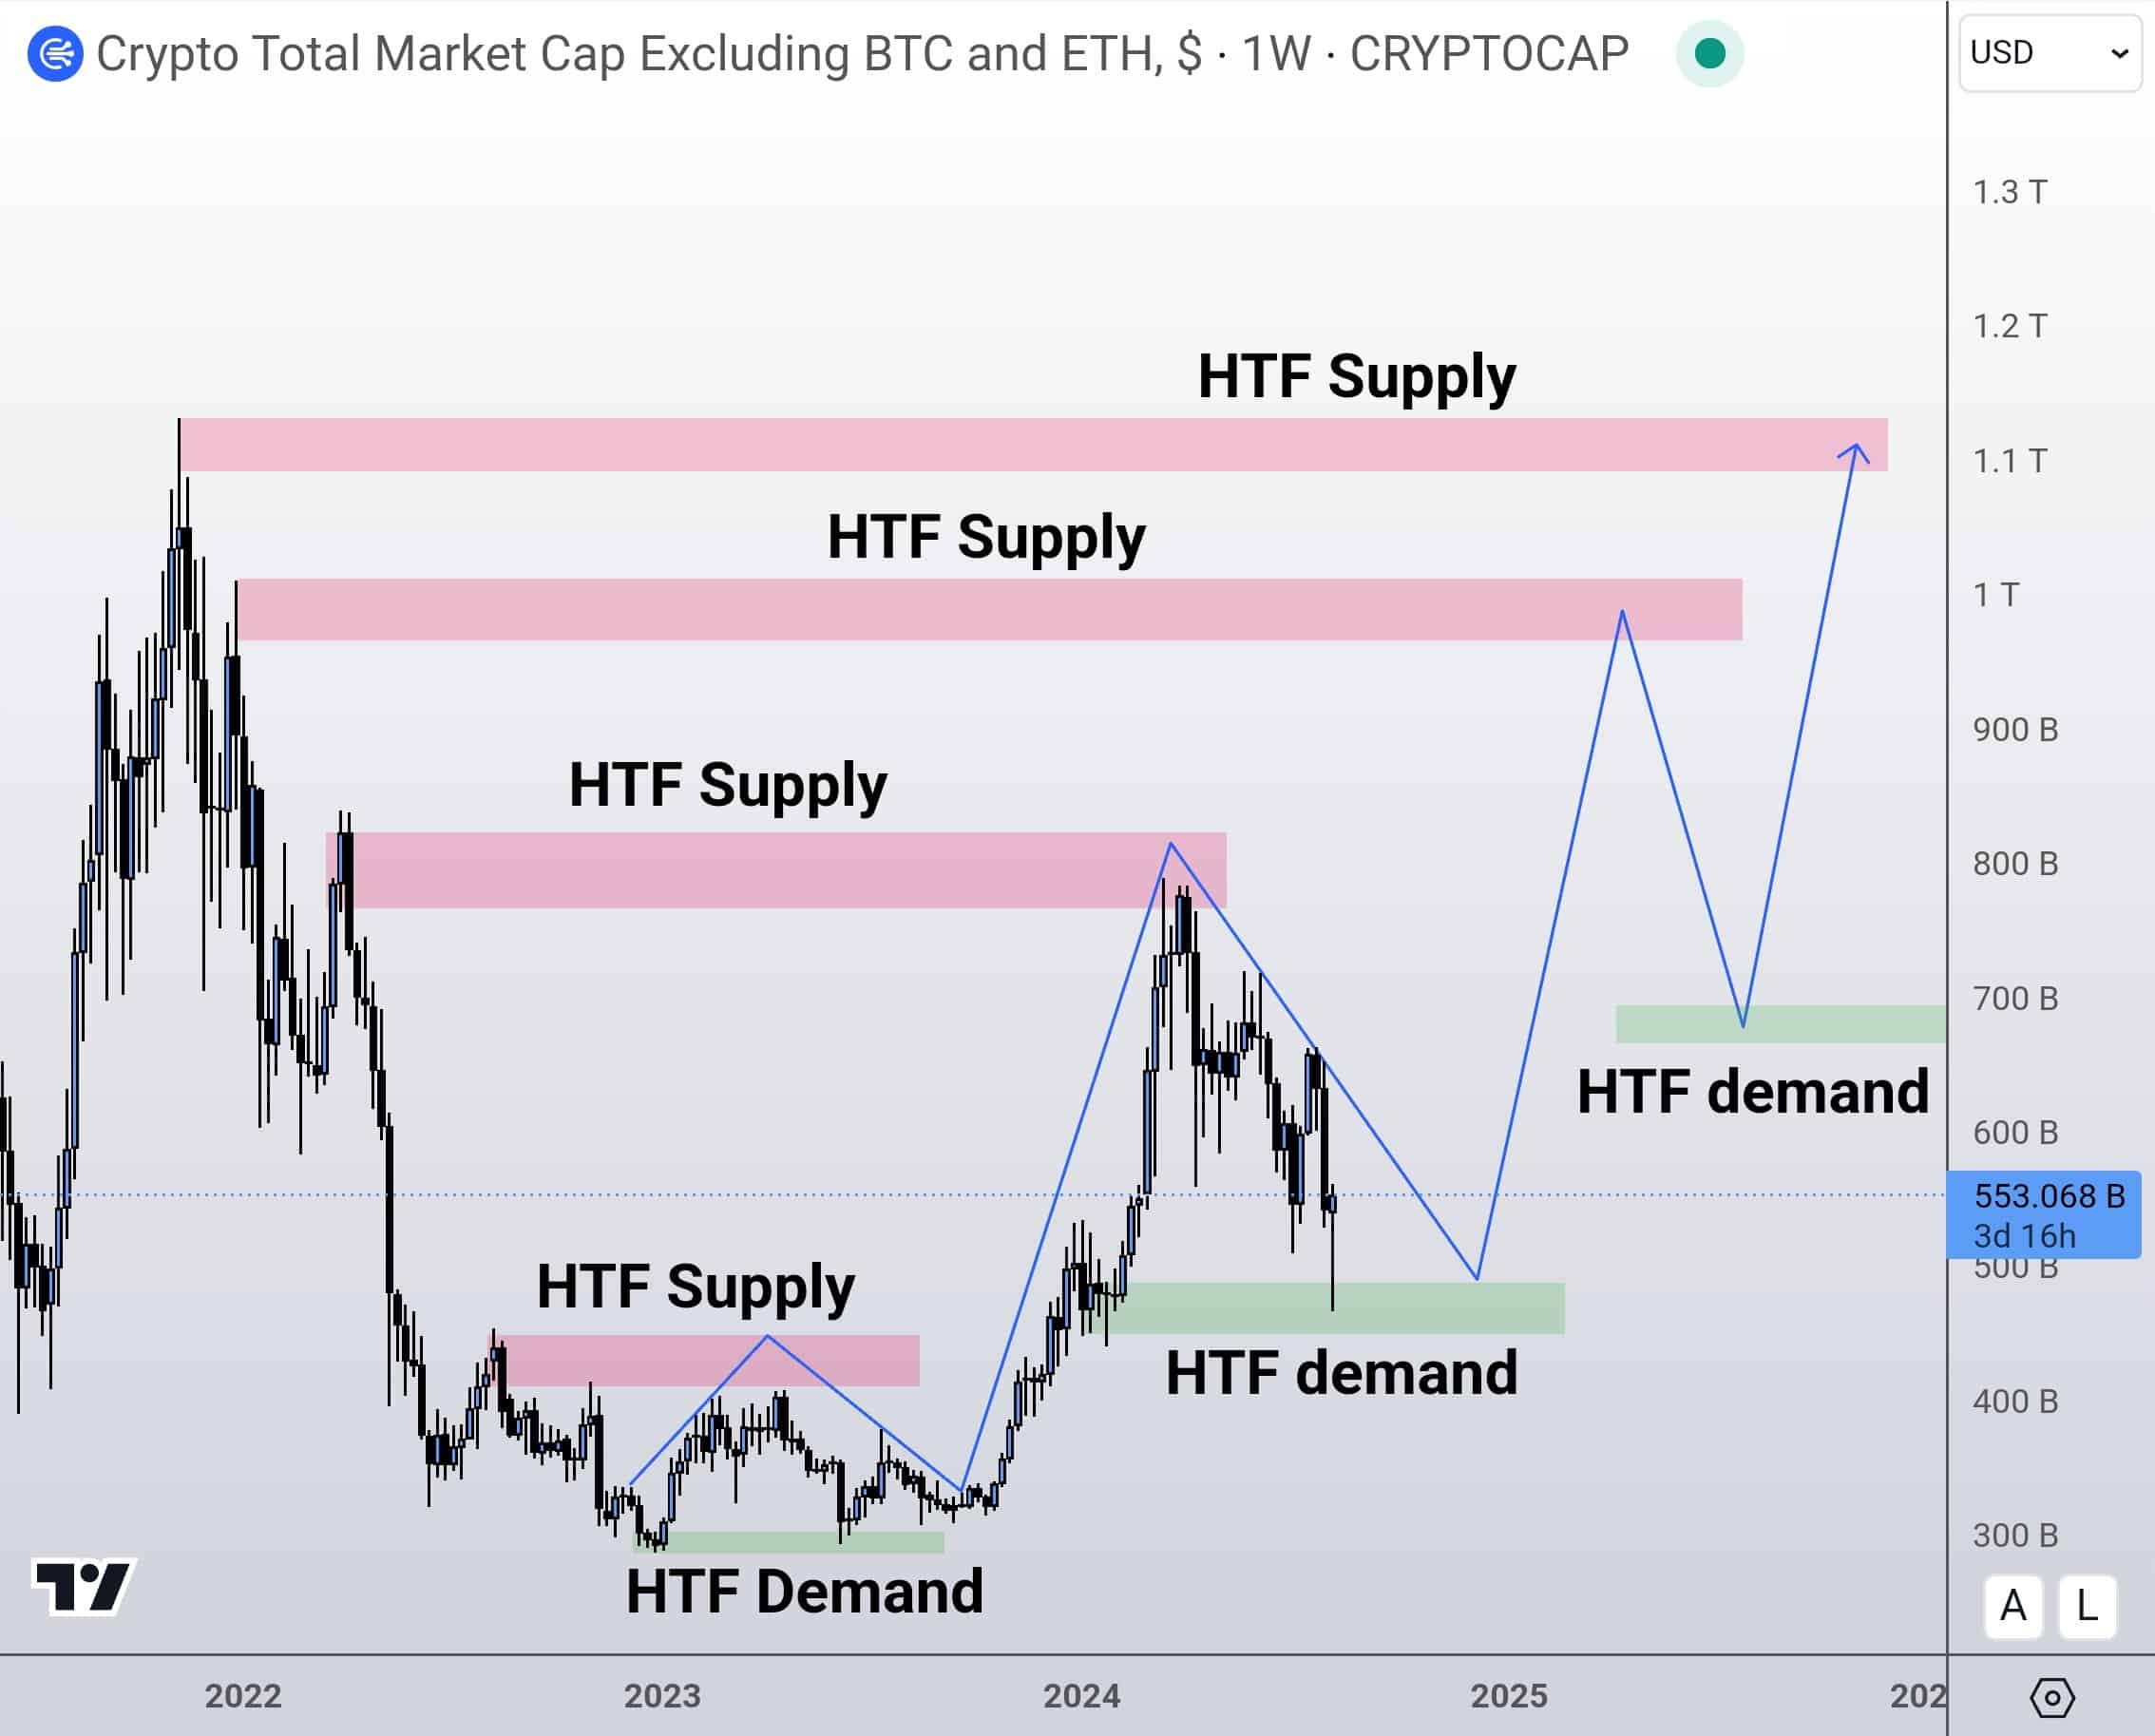
Source: TradingView
Sector performance in crypto
The past week, however, was challenging for altcoins, with many losing about 40% of their value from the previous week.
However, roughly half of those losses have since been recovered. Even so, no specific sector stood out, as most sectors have moved similarly, despite some bullish sentiments.
This broad recovery is a sign that Chainlink is likely to participate in the current market cycle’s uptrend.
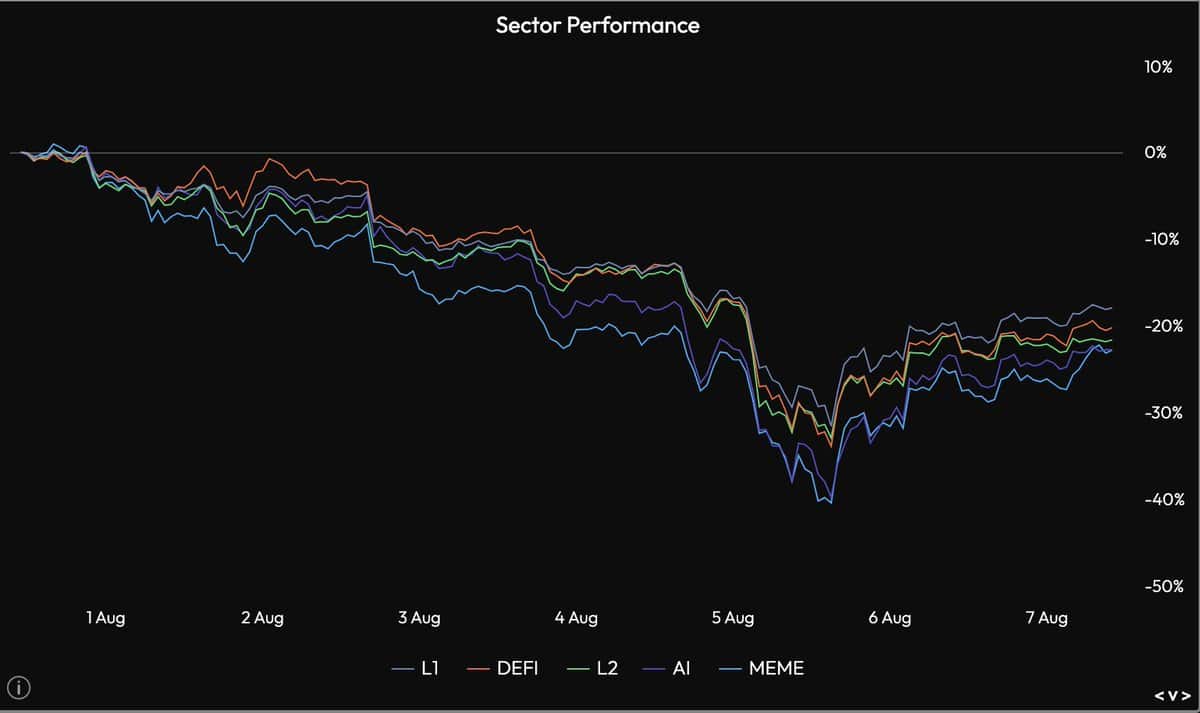
Source: Velo Protocol
‘Lowest average’
Finally, the Crypto Daily RSI Heatmap revealed that the average RSI was at its lowest point in a long time – At around 35% – which is typical of a bear market.
This can be interpreted as a sign that prices are at very low levels, making it an ideal time for traders and investors to buy in.
It’s worth noting though that these figures can change rapidly, as shown by the significant price movements of various coins over the past week.
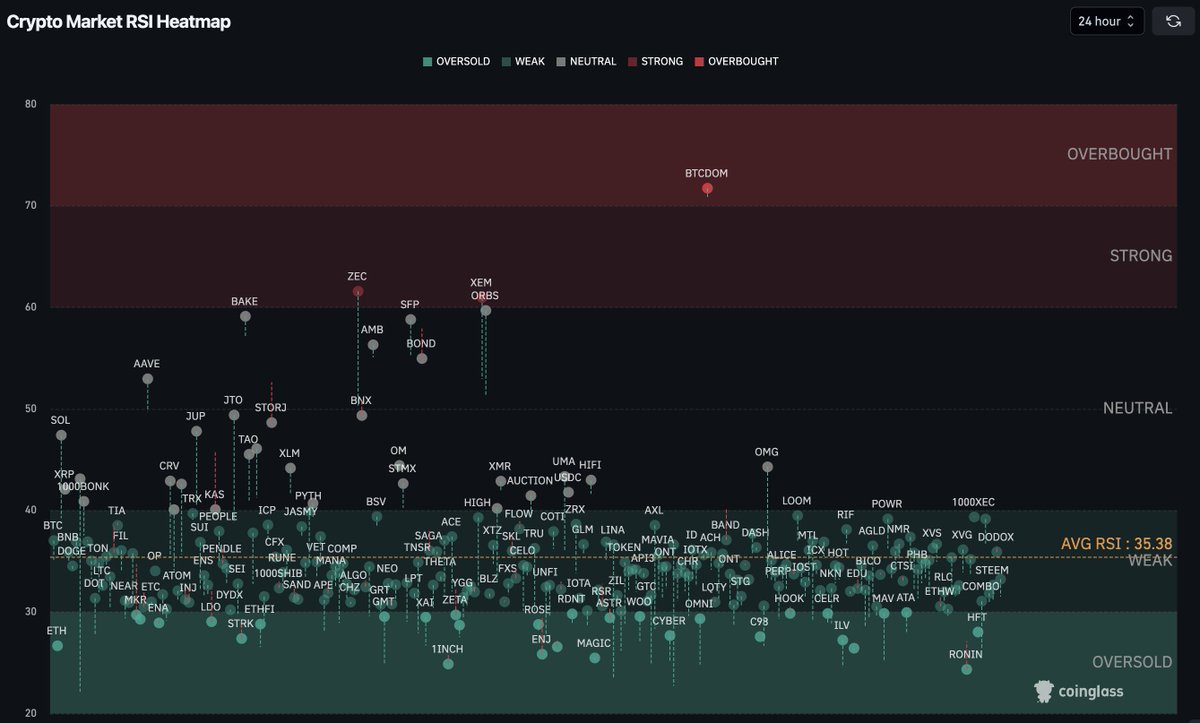
Source: Coinglass