


Disclaimer: The information presented does not constitute financial, investment, trading, or other types of advice and is solely the writer’s opinion.
- LINK’s recovery eased near $6.748.
- The recovery faced elevated short-term selling pressure.
Chainlink’s [LINK] downtrend eased near $6.3 on 12 May, allowing bulls to take the center stage. In the past four days, price action constricted tightly between Exponential Moving Averages (50-EMA/100EMA). It needs to be seen who will inflict a breakout – bulls or bears?
Read Chainlink [LINK] Price Prediction 2023-24
In the meantime, Bitcoin [BTC] faced difficulty holding above $27k at press time. LINK could be exposed to more short-term downside prospects in the next few hours/days if BTC fluctuations persist below $27k.
More consolidation or a likely breakout?
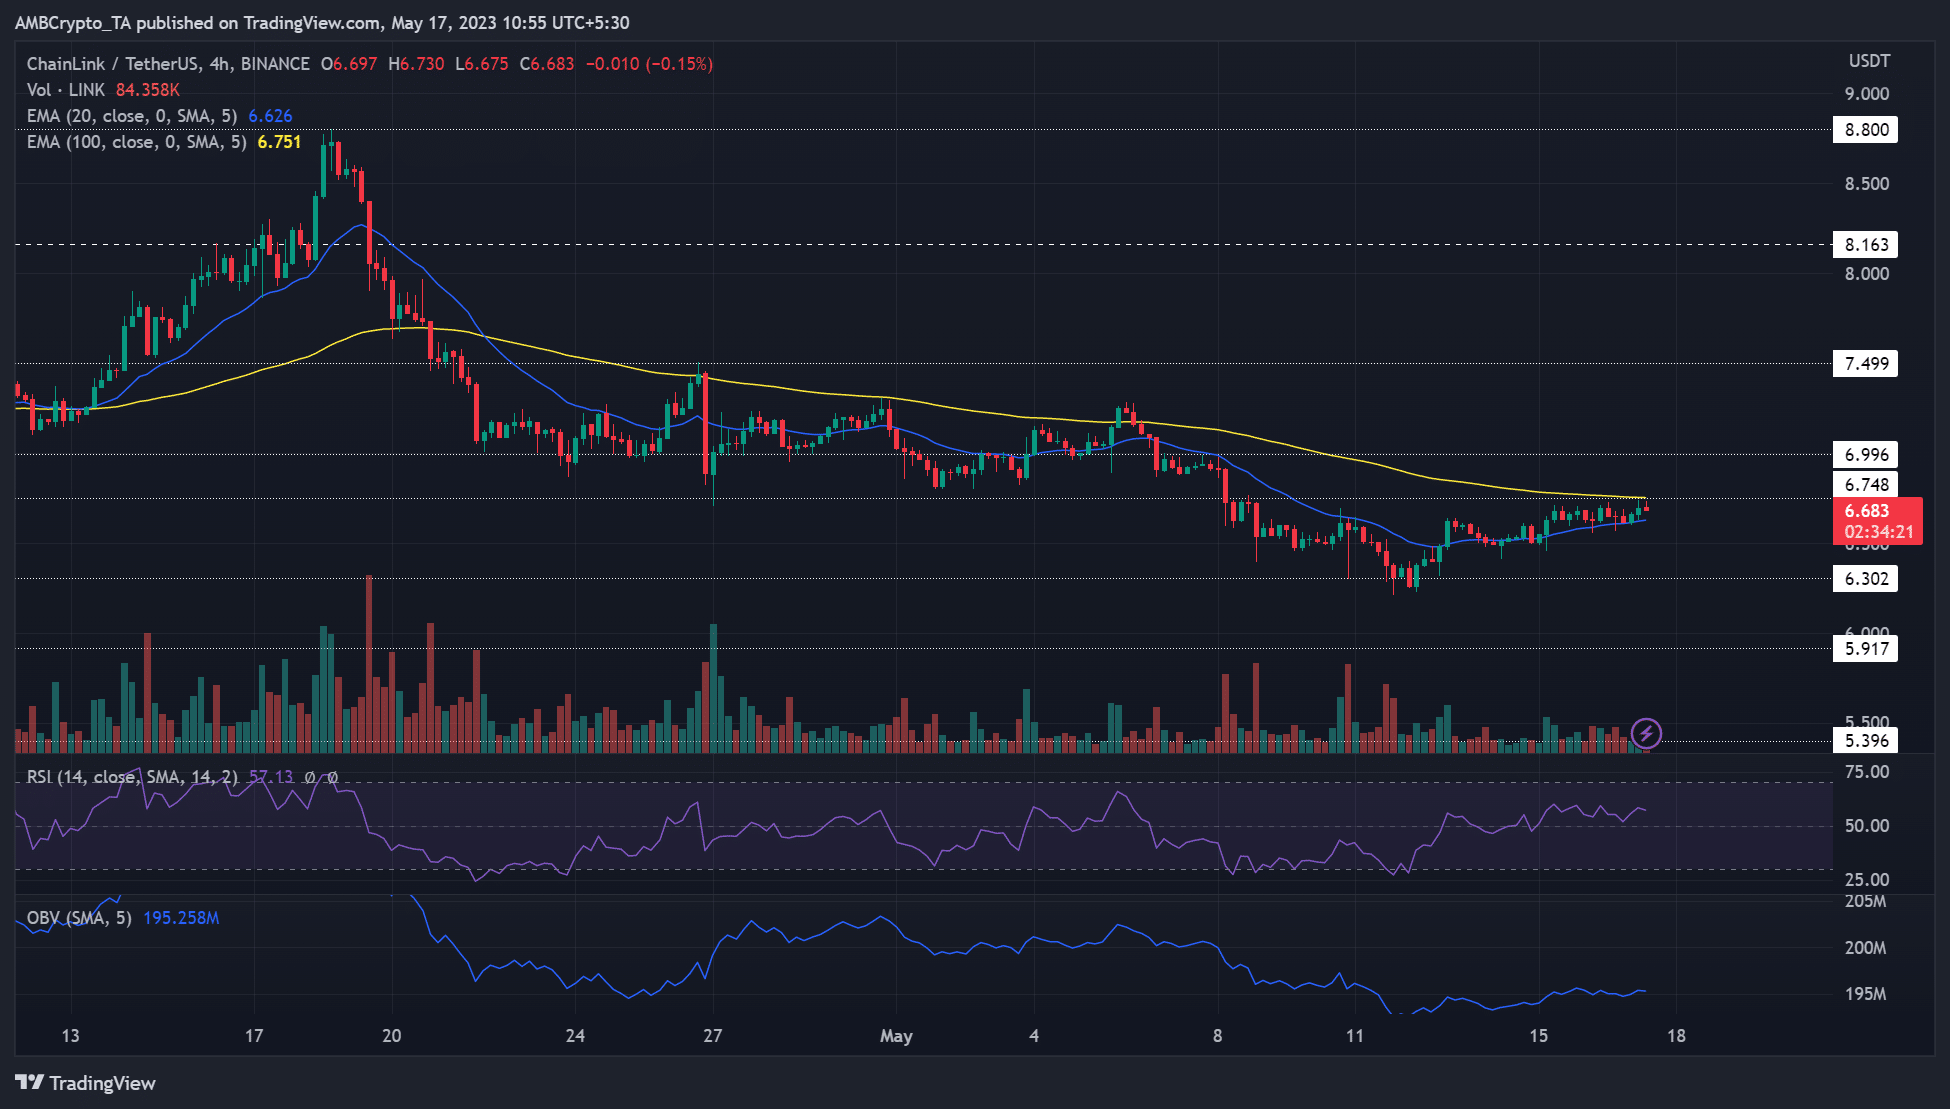
Sellers sunk LINK to $6.3 before bulls found steady ground and fronted a recovery. The rally got slightly boosted after climbing above the 20-EMA (blue line).
However, bulls haven’t been able to push beyond the 100-EMA, a key dynamic resistance level, since late April.
At press time, price action stalled just below the range high of $6.748. Interestingly, the range high also lines up with the sticky 100-EMA dynamic resistance level.
With BTC struggling to hold on to $27k, short-sellers could threaten to retest the range low of $6.3. But they’ll have to clear the 20-EMA obstacle to gain the upper hand.
Meanwhile, the RSI fluctuated above the median level in the past few days, highlighting improved buying pressure. The OBV also increased as demand improved in the past few days.
Short-term selling pressure looms large
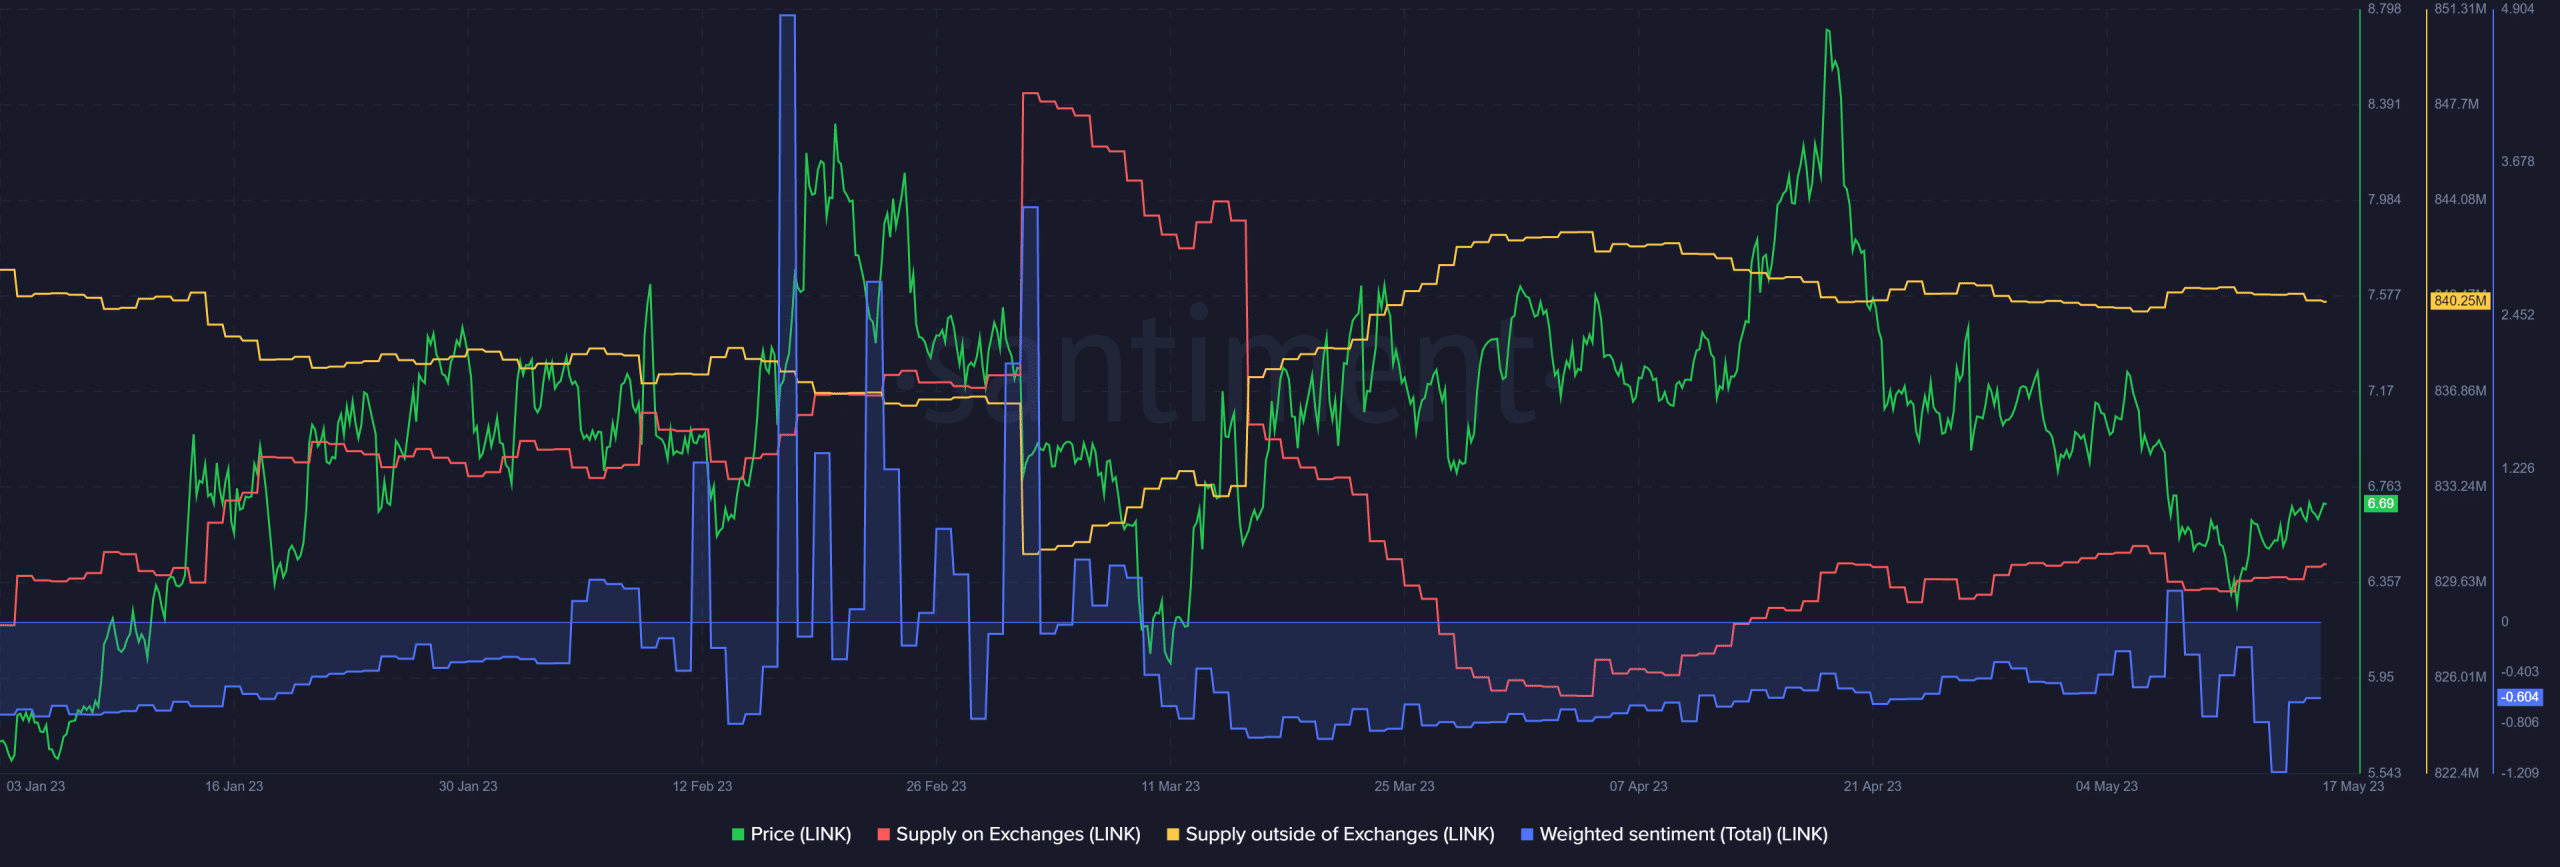
According to Santiment, the spikes in LINK’s supply on exchanges remained consistent since early April.
It shows more LINK tokens moved to centralized exchanges for offloading – indicating short-term selling pressure. The metric edged higher at press time, reiterating sellers’ leverage.
On the other hand, supply outside of exchanges, which tracks accumulation trends, declined in the same period.
How much are 1,10,100 LINKs worth today?
Similarly, the negative sentiment (blue) improved slightly with the mild rally but remained within the negative territory, showing investors’ reservations about the asset.
Ergo, if LINK’s short-range formation between $6.3 and $6.75 persists, investors can target range extremes for profit.