Chainlink [LINK]: ‘Successful recovery’ and what it means for adoption

One of Chainlink’s biggest strengths over the past year has been the rate of its product suite’s adoption. And, while that makes a big difference as a whole on the price action, it also drives investors towards the asset.
Contrary to expectations, alas, the same isn’t happening with Chainlink at the moment.
Chainlink loses its links
Despite the altcoin’s 40.92% rally over the last 20 days, LINK is losing its investors’ interest by the day. In fact, less than 2k investors seemed to be conducting transactions on-chain at press time.
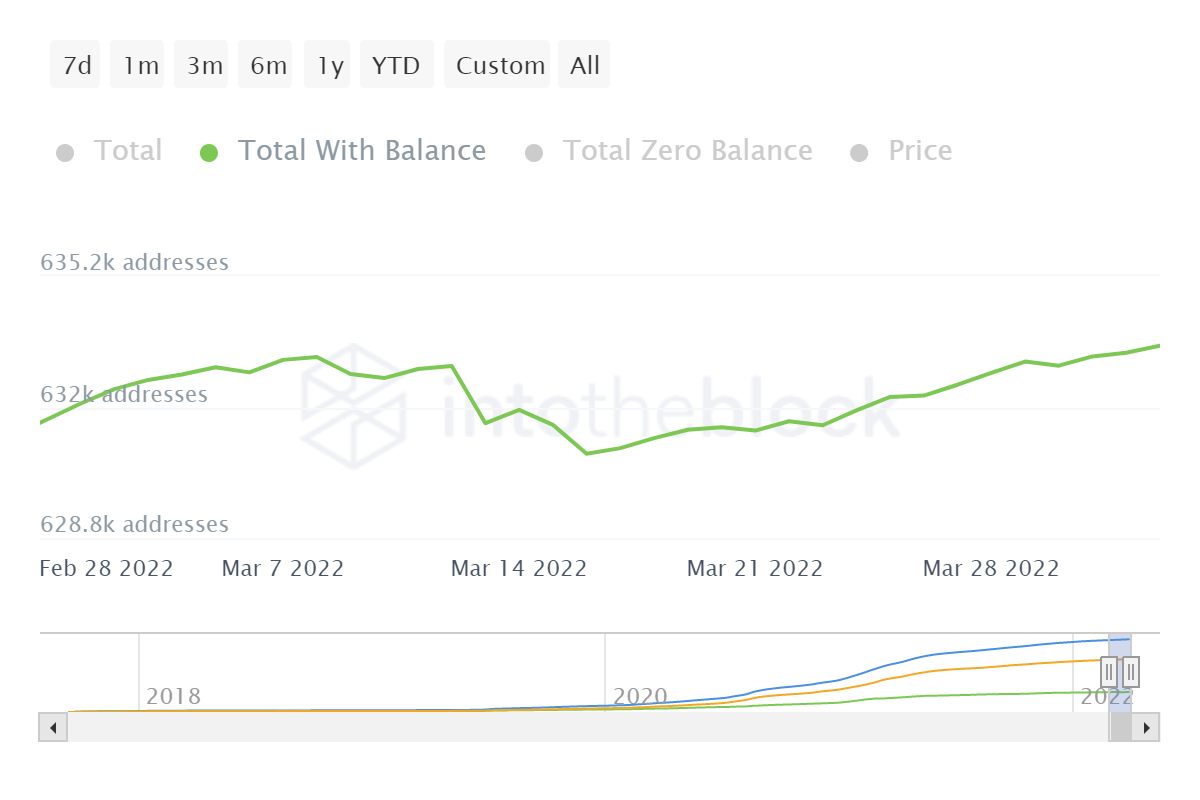
The aforementioned finding can also be supplemented by the most significant indicator of the same – Network Growth. The metric underlines the rate of adoption of the asset. After LINK failed to hit a new ATH like other alts, adoption began sliding.
At the time of writing, it had dropped by 69% on the charts.

Plus, the wobbling confidence of LINK holders is another matter of concern. This was the reason why within four days of 12 March, over 3k investors exited that market.
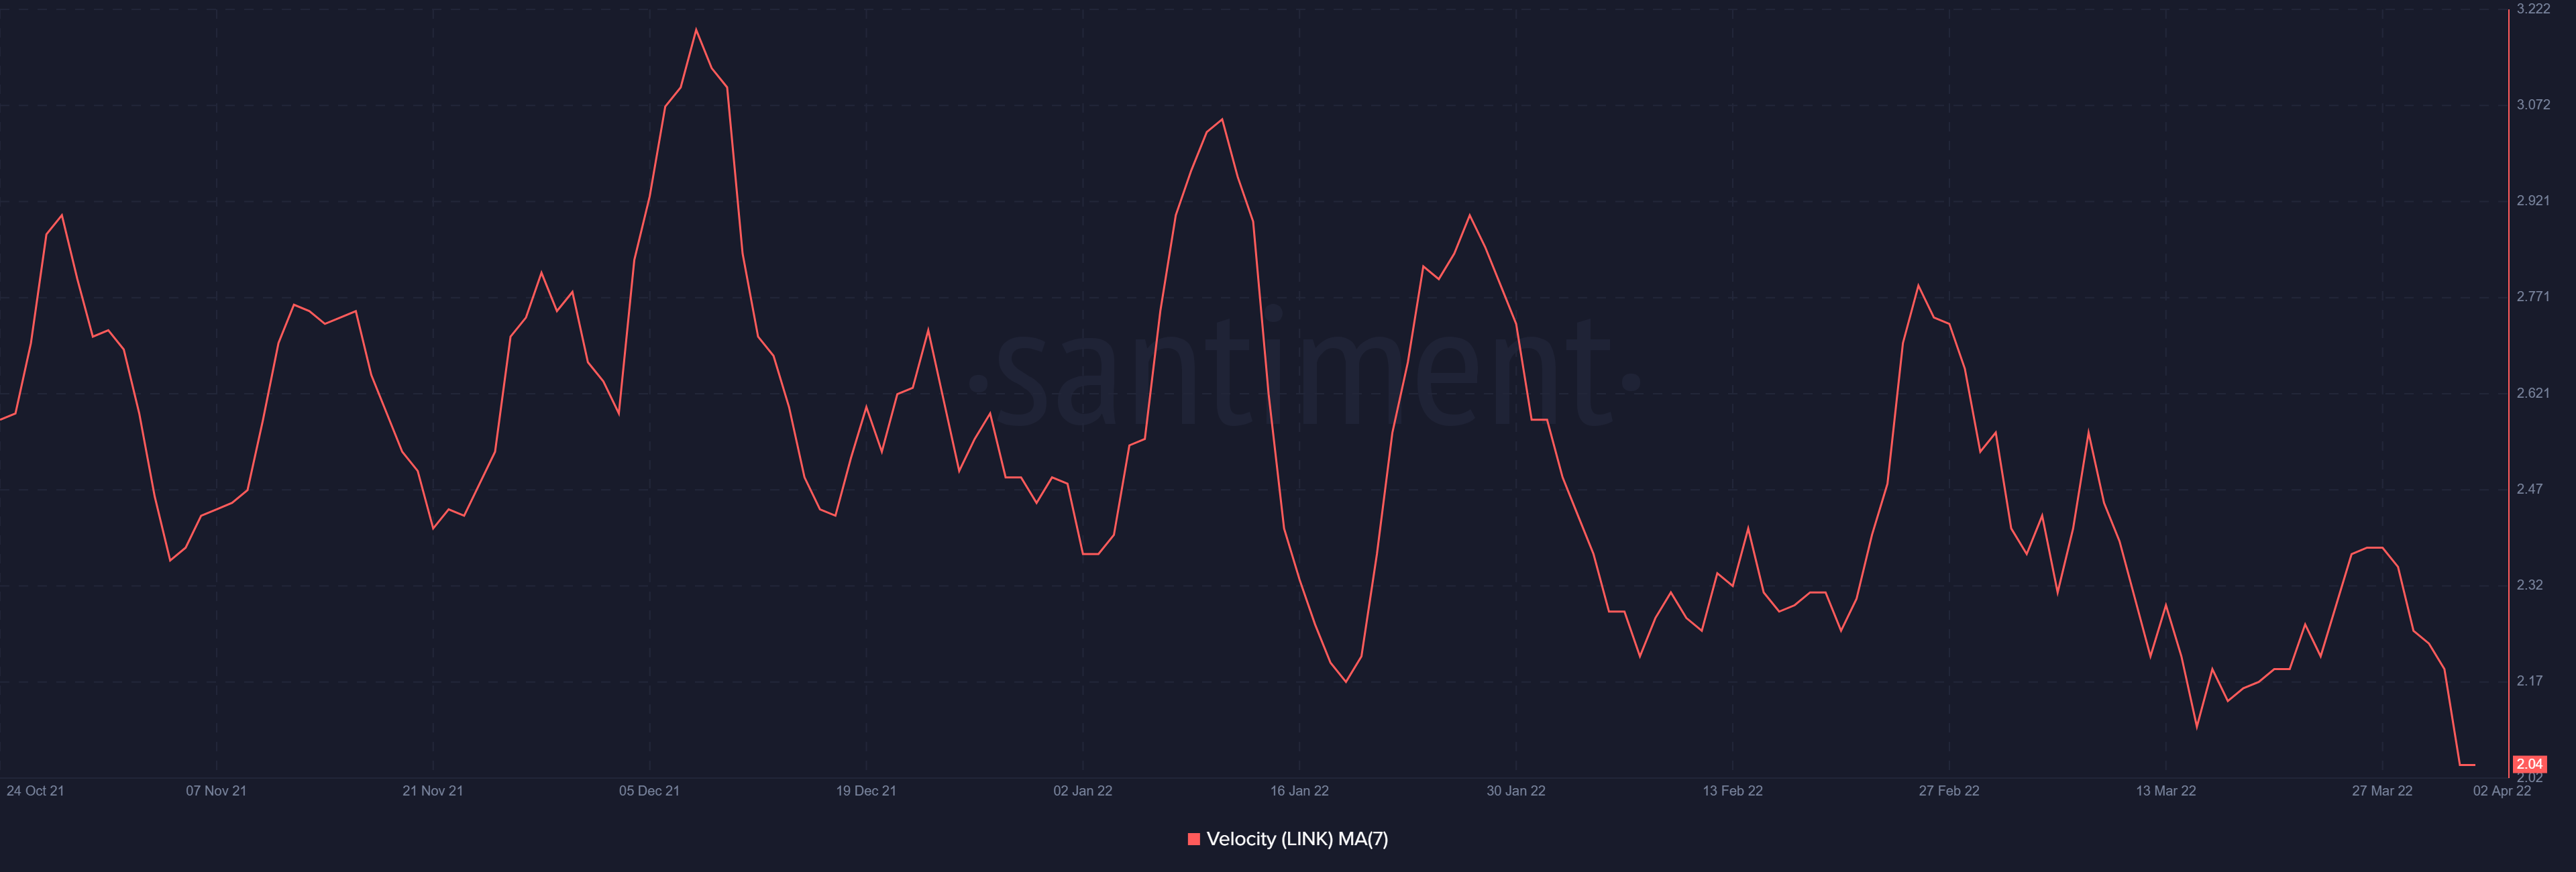
On account of this apprehension from investors, their activity has reduced. Consequently, most of the time, LINK ends up sitting idly in their wallets. As a result, the rate at which LINK changes hands has also fallen significantly.
Now, expecting changes in behavior following major ecosystem developments is understandable. However, just yesterday, after Chainlink announced another Chainlink – Filecoin grant for DZK Rollups, not much bullishness was seen.
Even so, LINK did achieve one major milestone this month – The end of its bearishness. After being stuck under the downtrend wedge for almost 11 months, following multiple failed breakout attempts, the altcoin is finally looking at some sustainable hikes.
What do the charts say about the price action?
Trading at $17.7 at press time, LINK turned the 50-day SMA (blue) back into support and was close to testing the 100 day SMA (pink). The only successful re0test of the 100 day SMA was back in August 2021, when LINK shot up by 153%.
That, however, won’t be the case this time since as per the MACD, bearishness has been creeping back again.
The red signal line is inching closer to establishing a bearish crossover by overtaking the blue MACD line. If the bars on the indicator turn red, expect a trend reversal which would make sense given the Relative Strength Index’s current position.
Standing only slightly below the overbought zone, the indicator could flip the trend and result in the price probably looking at consolidation or correction.
If LINK consolidates, the altcoin is looking at $20.99 as its next major resistance. Taking that level back would be the foremost signal of successful recovery.


