
After observing an inverse head and shoulder breakout in May, the bears have constricted buying rallies in the $9.29 region for nearly three months.
While the price kept traversing below the four-month trendline support (previous resistance), the sellers kept finding fresher multi-monthly lows until mid-June.
The past month, however, signified a solid buying comeback as LINK breached this trendline support to retest the $9.29 zone. The current pattern could reignite a short-term decline before a buying comeback. At press time, LINK traded at $9.055.
LINK Daily Chart
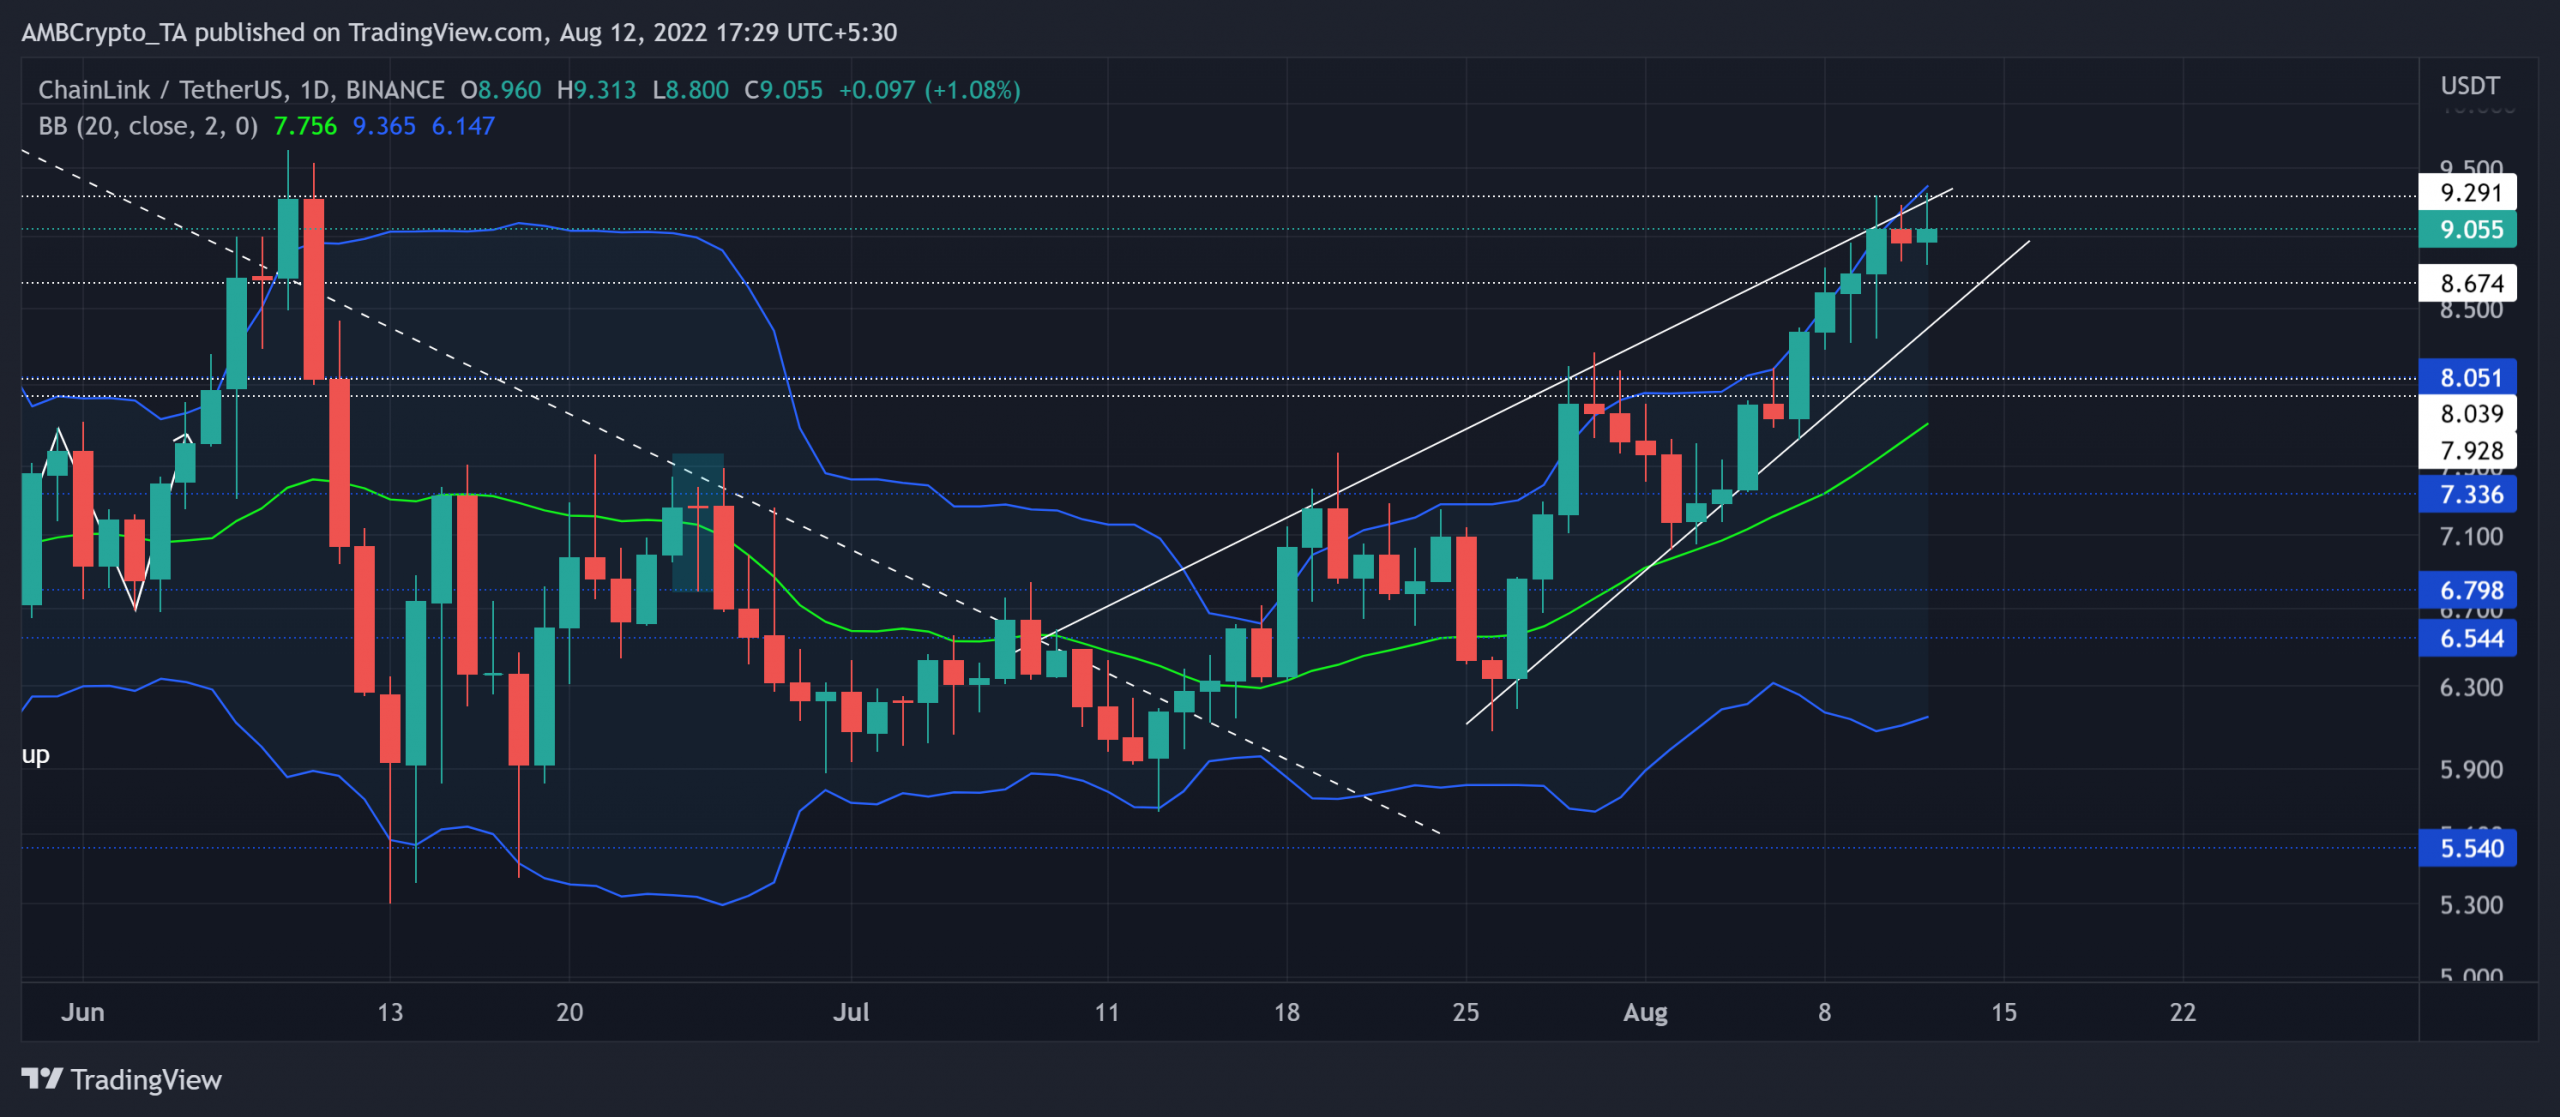
Source: TradingView, LINK/USDT
Since swooping low to its two-year low on 13 June, LINK buyers have been on a quest to reclaim critical price levels. The last month marked a decent bullish attempt as the alt noted a rising wedge recovery in the daily chart.
Consequently, the price action jumped above the basis line (green) of Bollinger Bands (BB) to reveal a bullish edge. But with the $9.29-mark resistance posing a near-term hurdle, any reversals could induce ease in the buying rally.
A potential close below the wedge could open gateways for a test of the $8-zone near the basis line of BB. Post which, the buyers would likely maintain their edge owing to the north-looking tendencies of the basis line and the broader momentum.
Rationale
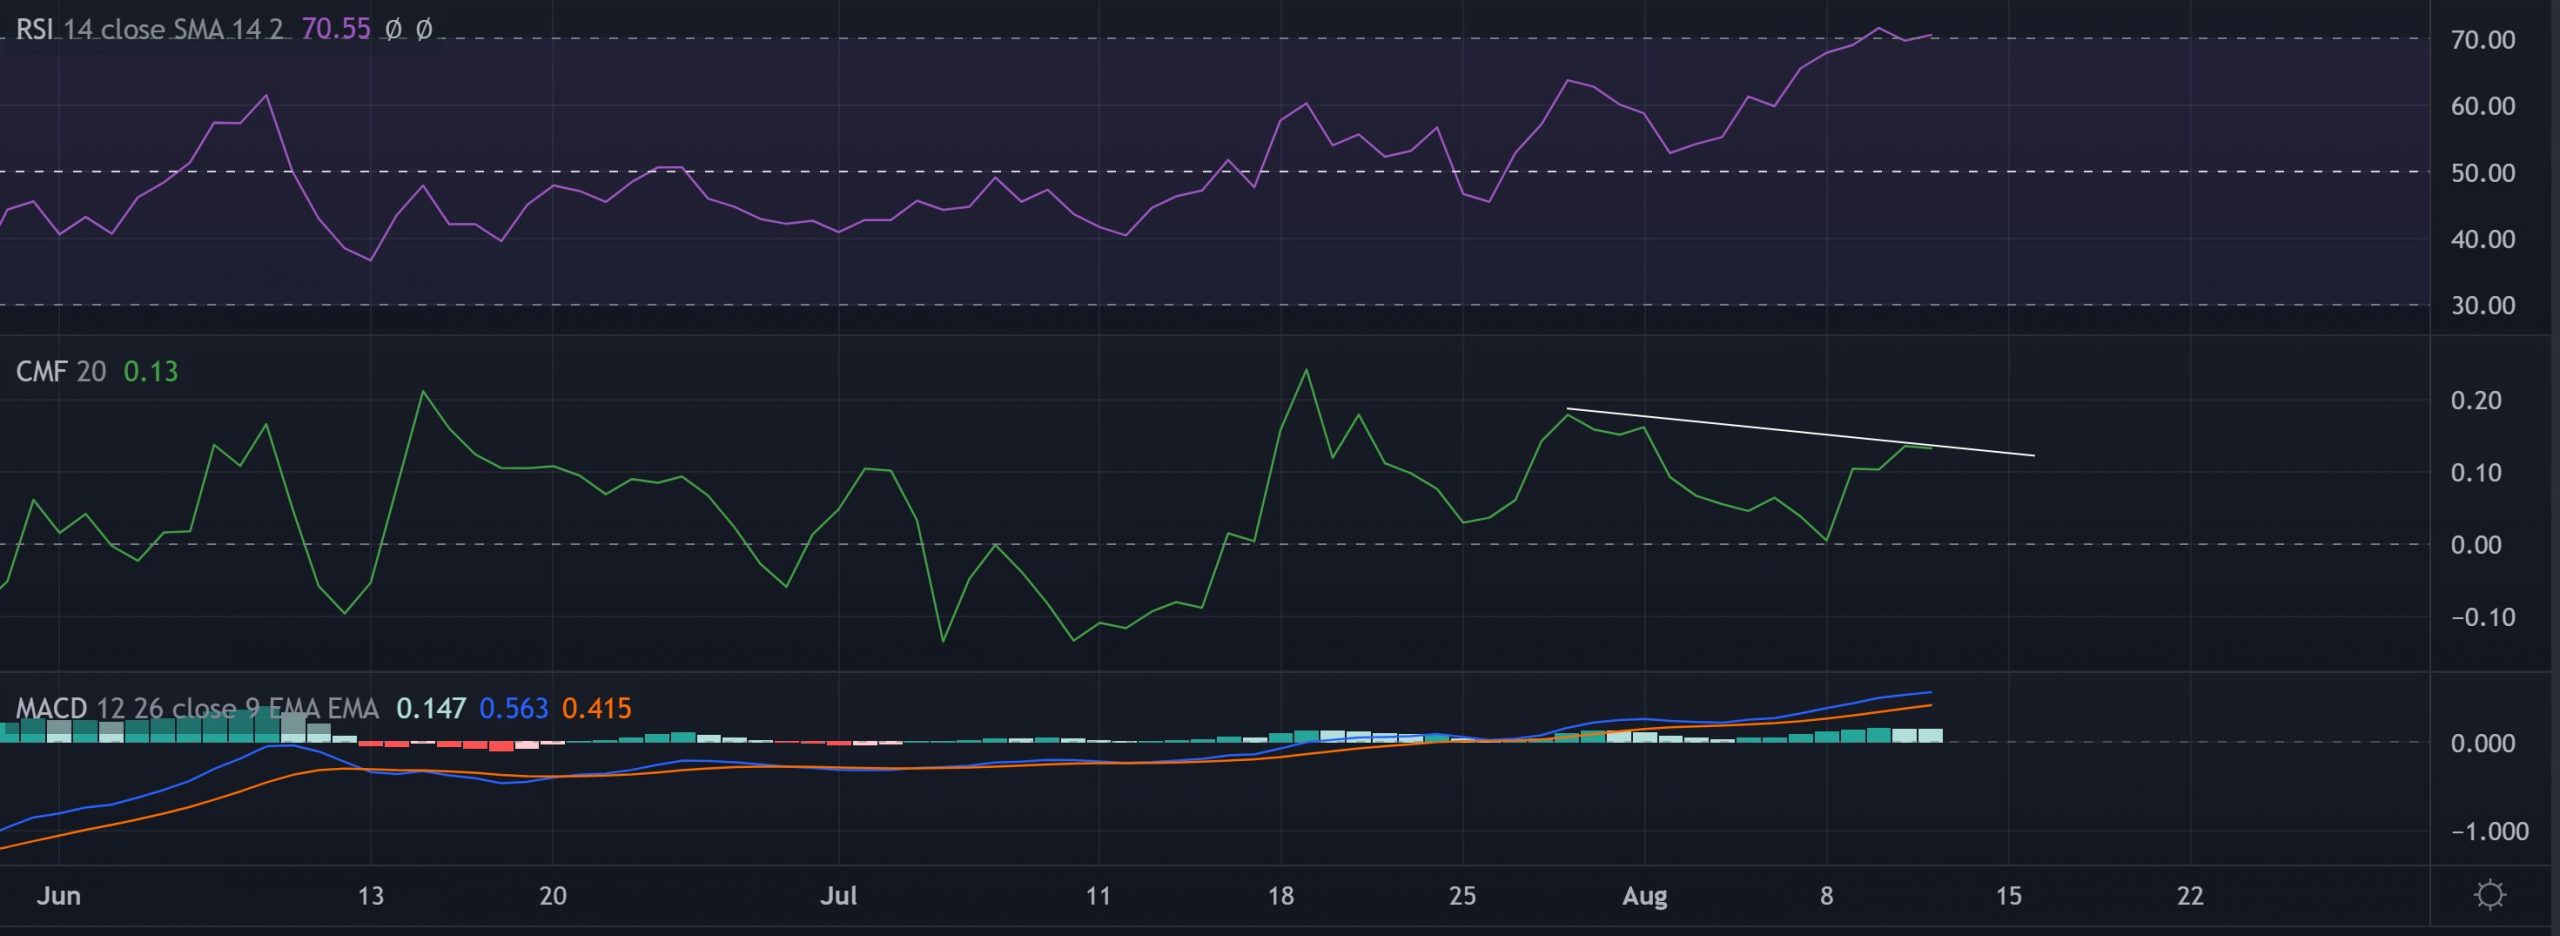
Source: TradingView, LINK/USDT
The Relative Strength Index entered the overbought region at the time of writing. The index has taken a strong bullish stance while the chances of a potential reversal were lurking around the corner.
The CMF’s devaluation of its peaks over the last few days has bearishly diverged with the price action. A continued trajectory in this direction could slow down the buying pressure. Nonetheless, the MACD still depicted a strong buying momentum while its lines maintained a spot above the zero-mark.
Conclusion
At press time, LINK’s rising wedge setup was approaching the three-month horizontal resistance. Additionally, the overbought readings on the BB and the RSI hint at the possibility of a conceivable near-term breakdown. The targets would remain the same as above.
Any bearish invalidations could see a relatively sluggish phase near the POC zone. Finally, an overall market sentiment analysis becomes vital to complement the technical factors to make a profitable move.


