Chainlink, MATIC, AAVE Price Analysis: 18 June

On the back of wider market devaluations, altcoins such as Chainlink, MATIC, and AAVE sustained losses over the past couple of days. This reversed the positive momentum that had slowly started to pick up following the coins’ recent price action as market volatility increased and trading volume decreased.
Bitcoin moved back down to $37,940 at press time after testing the important $40,000-resistance mark, with the global crypto-market falling by 3.14% in the last 24 hours.
Chainlink [LINK]
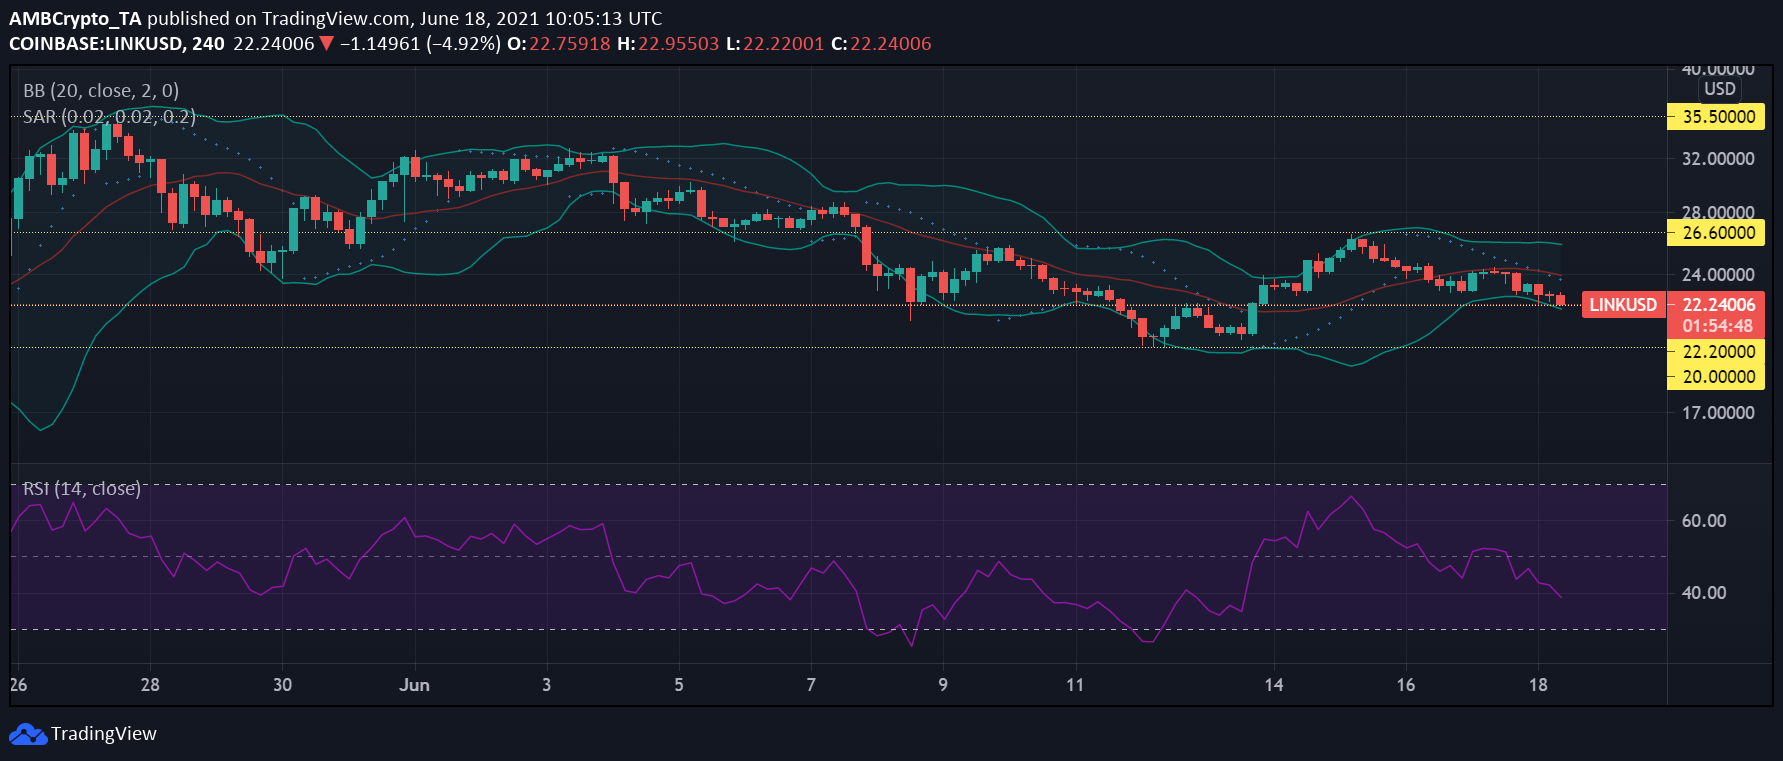
Conditions have been unfavorable for LINK in June as the alt fell through two support levels at $26.5 and $22. Although recoveries were made on 12 June, the cryptocurrency was testing the $22.2-mark, at the time of writing, as it was priced at $22.29.
Selling pressure for the asset continued to mount, however, as the Relative Strength Index or RSI moved below the median line into bearish territory. The indicator’s purple line was at 38, at the time of writing, and it could visit the oversold zone going forward.
Moreover, the Parabolic SAR’s dotted line has hovered above the candlesticks since 16 June, pointing to a sustained bearish trend for the altcoin’s price movement. The Bollinger Bands diverged slightly as market volatility started to pick up too.
As it was trading in the red, a further drop in valuation could see the coin reaching for the $20-support.
Matic [MATIC]
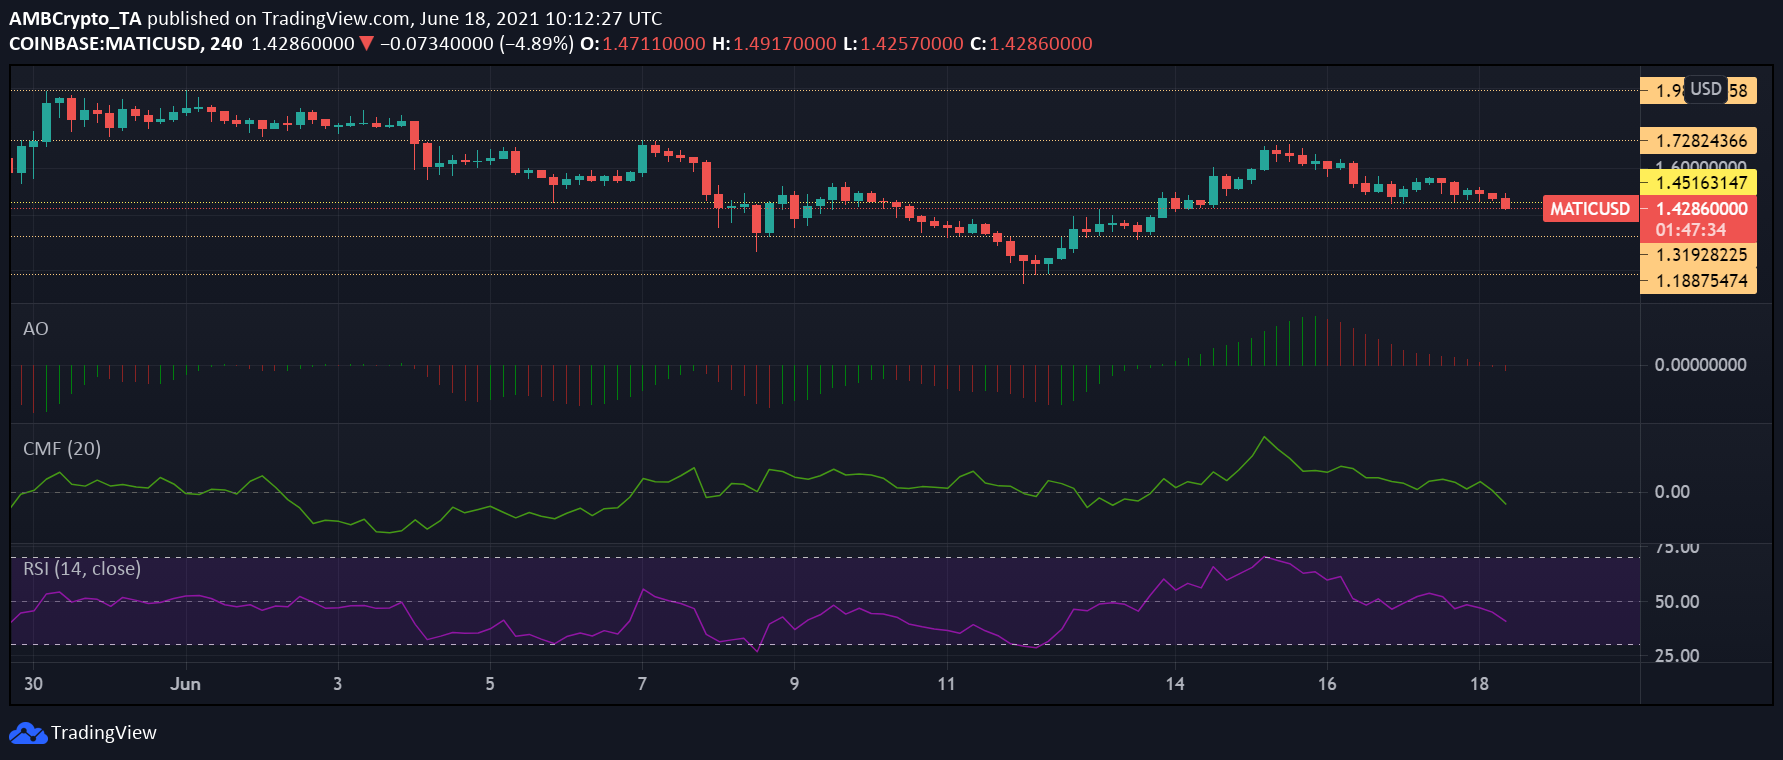
MATIC was trading at $1.42, at the time of writing, breaching the $1.45-support. Its trading volume fell by 38.71% over the past 24 hours, while its valuation fell by 7.6%. It was down by 43.9% from its all-time high of $2.62 exactly a month back.
Bearish momentum was starting to pick up as the Awesome Oscillator’s red bars on the histogram moved below the half-line. The dominance of capital outflows over inflows indicated that investors were rushing to sell off the coin as the Chaikin Money Flow’s indicator moved below equilibrium too/
The Relative Strength Index or RSI also highlighted surging selling pressure.
If the coin continues its southbound movement, a fall of 8.4% could bring the coin to its next support level at $1.31.
Aave [AAVE]
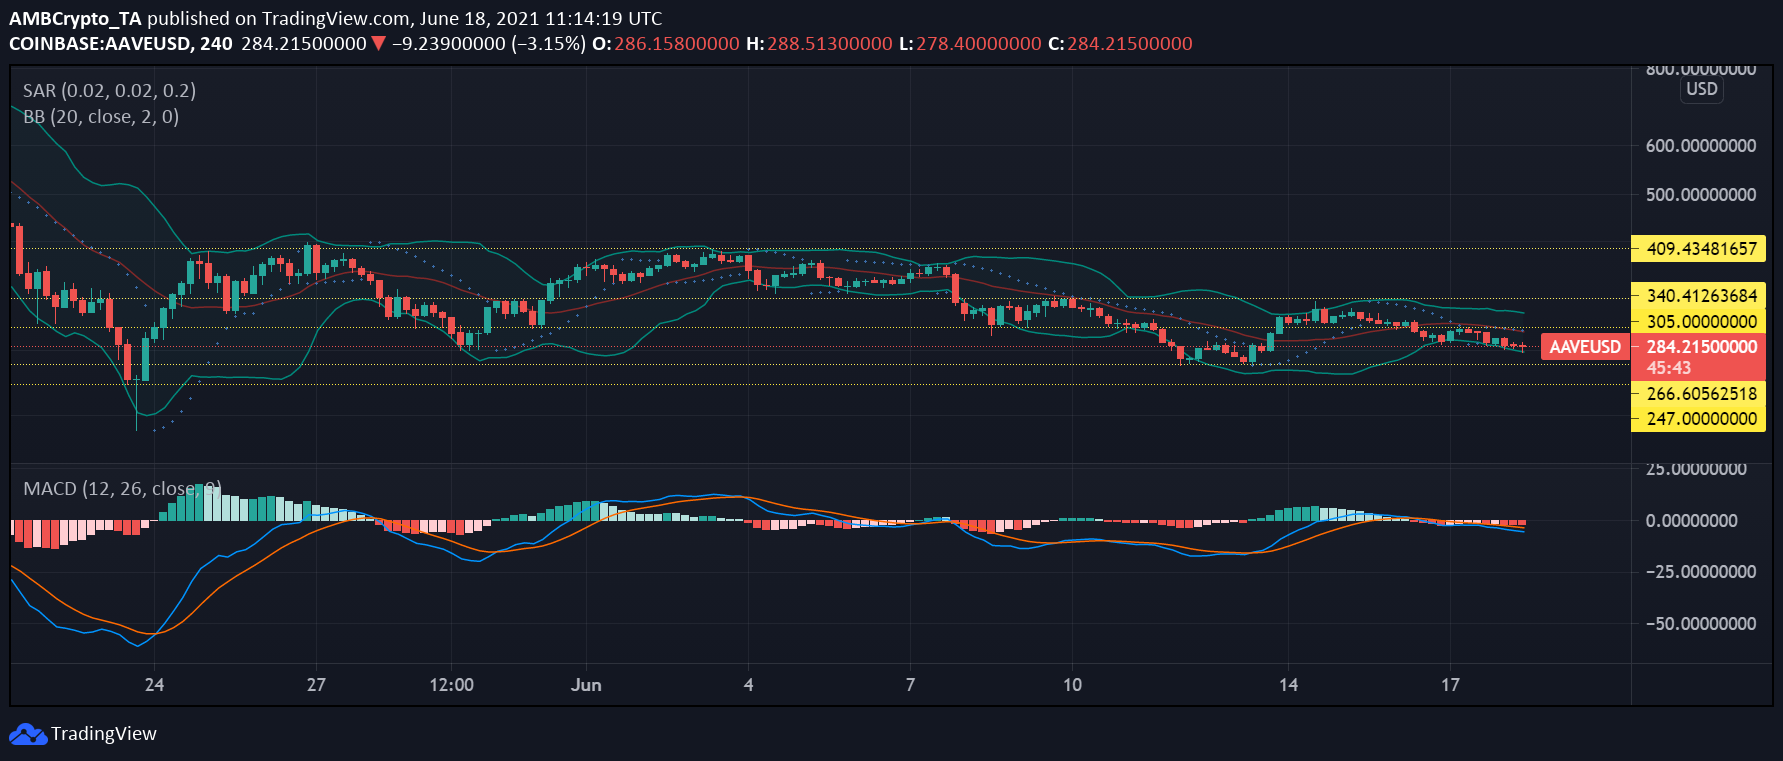
After losing 15.5% of its valuation on 7 June and breaking through the $340-support, AAVE fell a further 11.6% on 11 June. While it briefly reversed these losses in the succeeding days, the altcoin has since been following a downward trend, sandwiched between the $305 resistance and $266 support marks on the 4-hour chart. The coin was trading at $266 at press time, dropping by almost 6% over the previous day.
The MACD registered a bearish crossover on 16 June as the Signal line moved over the blue indicator. Even though the lines were pretty close around the neutral zone, another crossover seemed unlikely going forward.
The Parabolic SAR moved over the candlesticks after a brief stint to the downside as the coin’s price action started to follow a bearish trend again. Price volatility for the asset started to increase as the Bollinger Bands showed divergence.


