
Chainlink was expected to shrug off a minor correction, with LINK projected to rise to record levels on the back of a strong bull run. XEM could also move north on the charts if the market’s bulls hold on to the $0.377-support level. Finally, Enjin was in danger of dropping below its 50-SMA as momentum rested with the sellers.
Chainlink [LINK]

Source: LINK/USD, TradingView
The market’s bears took control of the Chainlink market over the last few trading sessions as the crypto’s price cooled off from yesterday’s ATH. The said momentum was captured by the Awesome Oscillator as the red bars moved towards the half-line.
A deeper correction could see LINK move south towards the $28.5-support level. However, taking the recent bull run into account, the correction is likely to be temporary, with the market’s bulls favored in the long run.
The CMF showed that the flow of institutional money was strong as the index stayed above the half-mark. The end of the consolidation phase will likely see LINK snap a newer record high on the charts.
NEM [XEM]
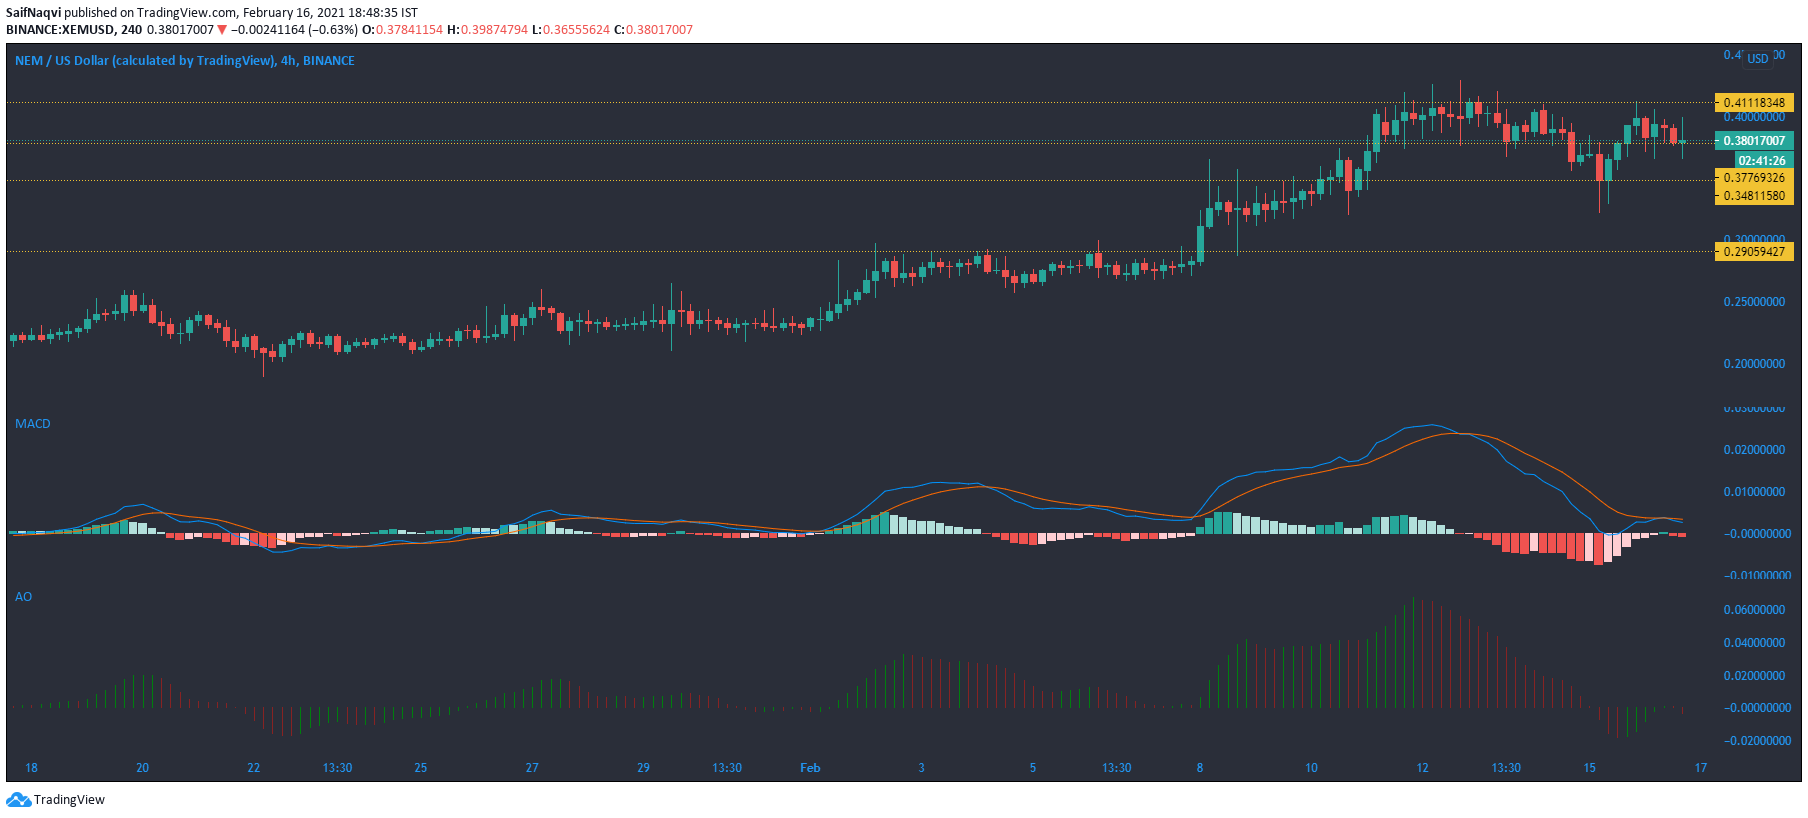
Source: XEM/USD, TradingView
At the time of writing, NEM was trading in the green territory as the price rose by a modest 2% in the last 24 hours. However, the indicators favored the sellers as the MACD line moved below the Signal line, and the Awesome Oscillator slipped below equilibrium.
The support level at $0.377 could be significant and a bullish trend could emerge if the level withstands selling pressure. If the price slips below the aforementioned support, NEM could challenge the next line of defense at $0.348.
Enjin [ENJ]
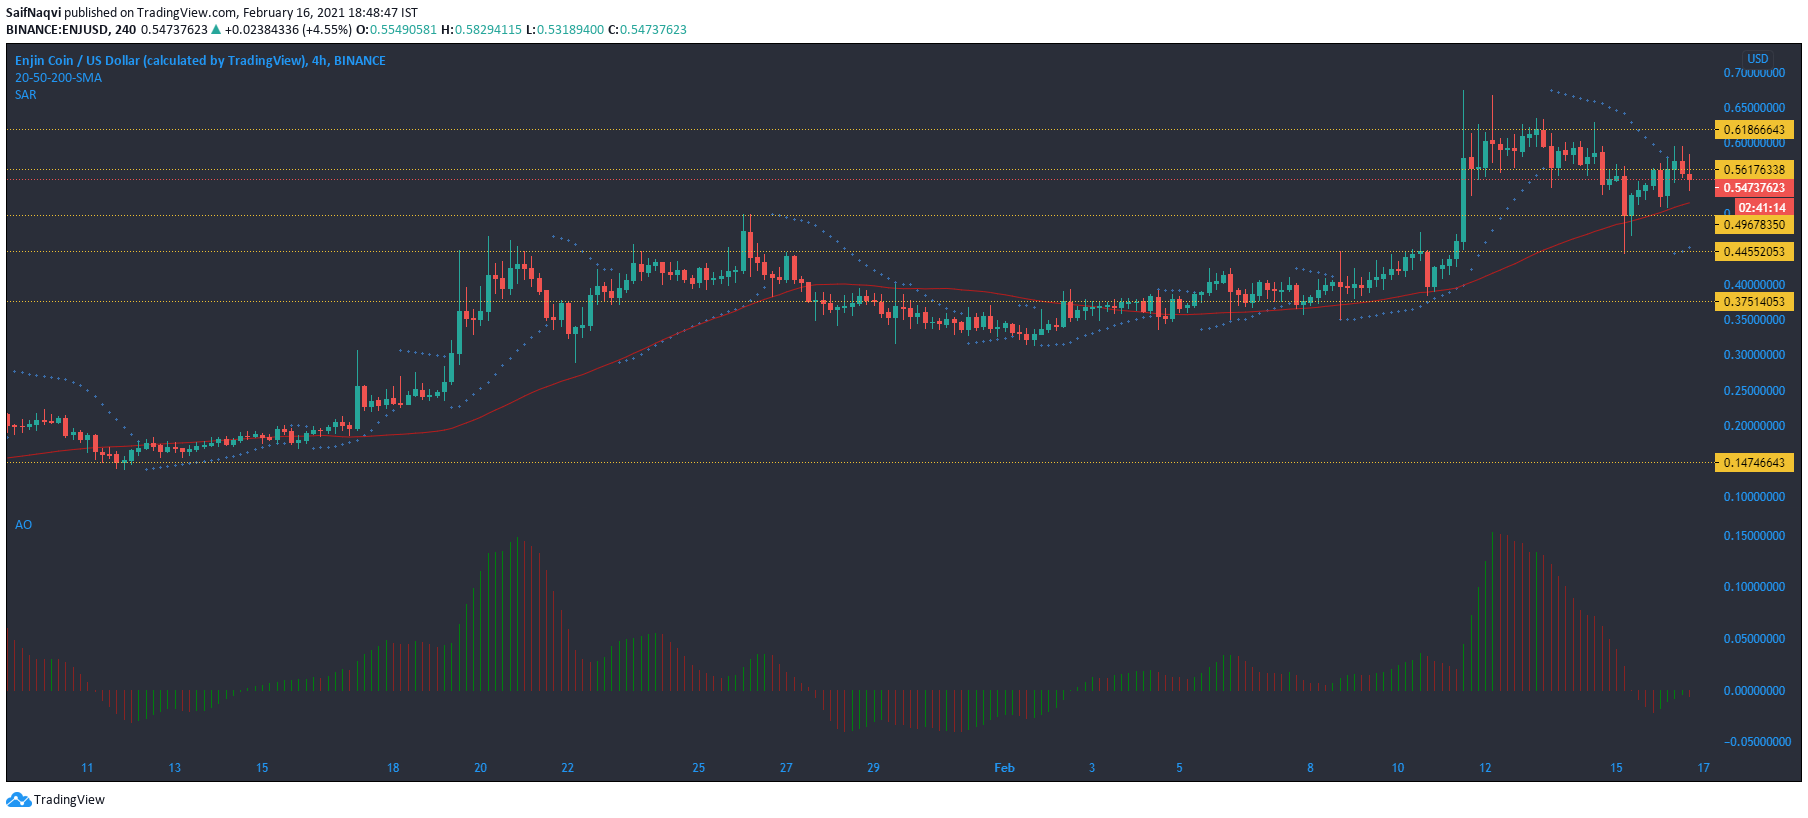
Source: ENJ/USD, TradingView
The bullish momentum which carried Enjin coin to record levels seemed to be fizzling out as the price dropped below the $0.56-resistance at press time. The Awesome Oscillator moved below half-line as momentum switched to the selling side.
A drop below the 50-SMA (red) could lead to a further sell-off and mark a downtrend for ENJ. On the other hand, the Parabolic SAR favored a more optimistic outcome as the dotted markers moved below the candlesticks. A pickup in the 24-hour trading volumes could push ENJ towards its $0.65-resistance level.

![Why Chainlink [LINK] and Polygon [MATIC] are more similar than you realise](https://ambcrypto.com/wp-content/uploads/2024/04/Chainlink_and_Polygon-1-400x240.webp)