

Disclaimer: The findings of the following analysis are the sole opinions of the writer and should not be taken as investment advice
Chainlink’s [LINK] market, at press time, was recovering after the market-wide fall on the 12th of May. In fact, LINK was once trading at $49.80, following which, it collapsed by 18% and plunged to $40.77.
At the time of press, however, some recovery was afoot, with LINK priced at around $44.63 despite its resistance level holding firm.
Chainlink four-hour chart
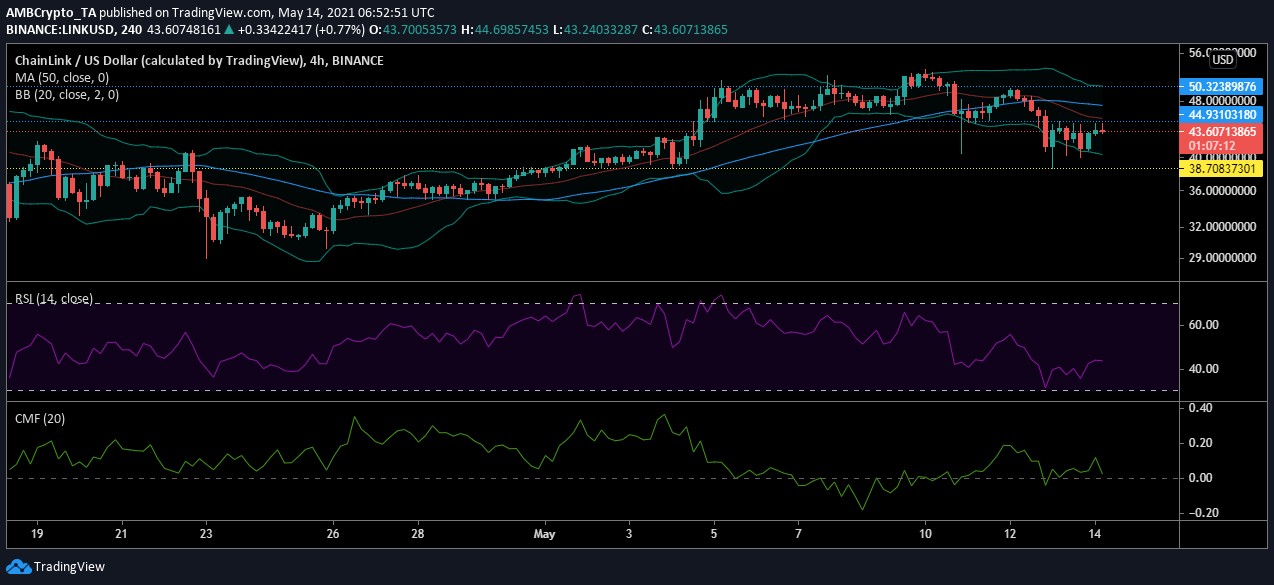
Chainlink’s four-hour chart highlighted how the digital asset was once trading under $38, before the bullishness in May managed to push the price higher. The price of LINK has risen by 15% in May and after its latest hiccup, the price may continue with its sideways movement on the charts.
Reasoning
According to the aforementioned chart, LINK’s price has been testing the top resistance at $50, but has not been able to hold on to a value above this level. After the recent re-test of this resistance, the price collapsed to the support at $38, after which it began to recover again.
This shifted the volatility in the market and this was visible in the divergence of the Bollinger Bands. As the market recovered, the LINK market moved sideways with a rising bearishness. The Signal line slid above the candlesticks, which was an indication of the price trending lower.
Meanwhile, the consolidation pressure was highlighted by the Relative Strength Index that remained at 47, close to the equilibrium zone. This meant that the buying and selling pressures were evened out and the traders agreed with the press time trading price.
Conclusion
The general bearish volatility in the wider market pushed LINK down the bearish path. However, the said bearishness has also pushed the price to a territory comfortable for the buyers and the sellers. With LINK testing the resistance level at $44, the traders may want to hold on to the current price level for a trend change.