Chainlink price prediction – Can rising outflows fuel more gains?

- Chainlink has posted steady outflows over the past month, showing easing selling activity.
- A surge in buying activity and network usage could also fuel more gains.
Chainlink [LINK] was showing signs of a reversal from bearish trends after an 11% gain in 24 hours to trade at $11.85 at press time. These gains come as traders continue to withdraw their LINK tokens from exchanges.
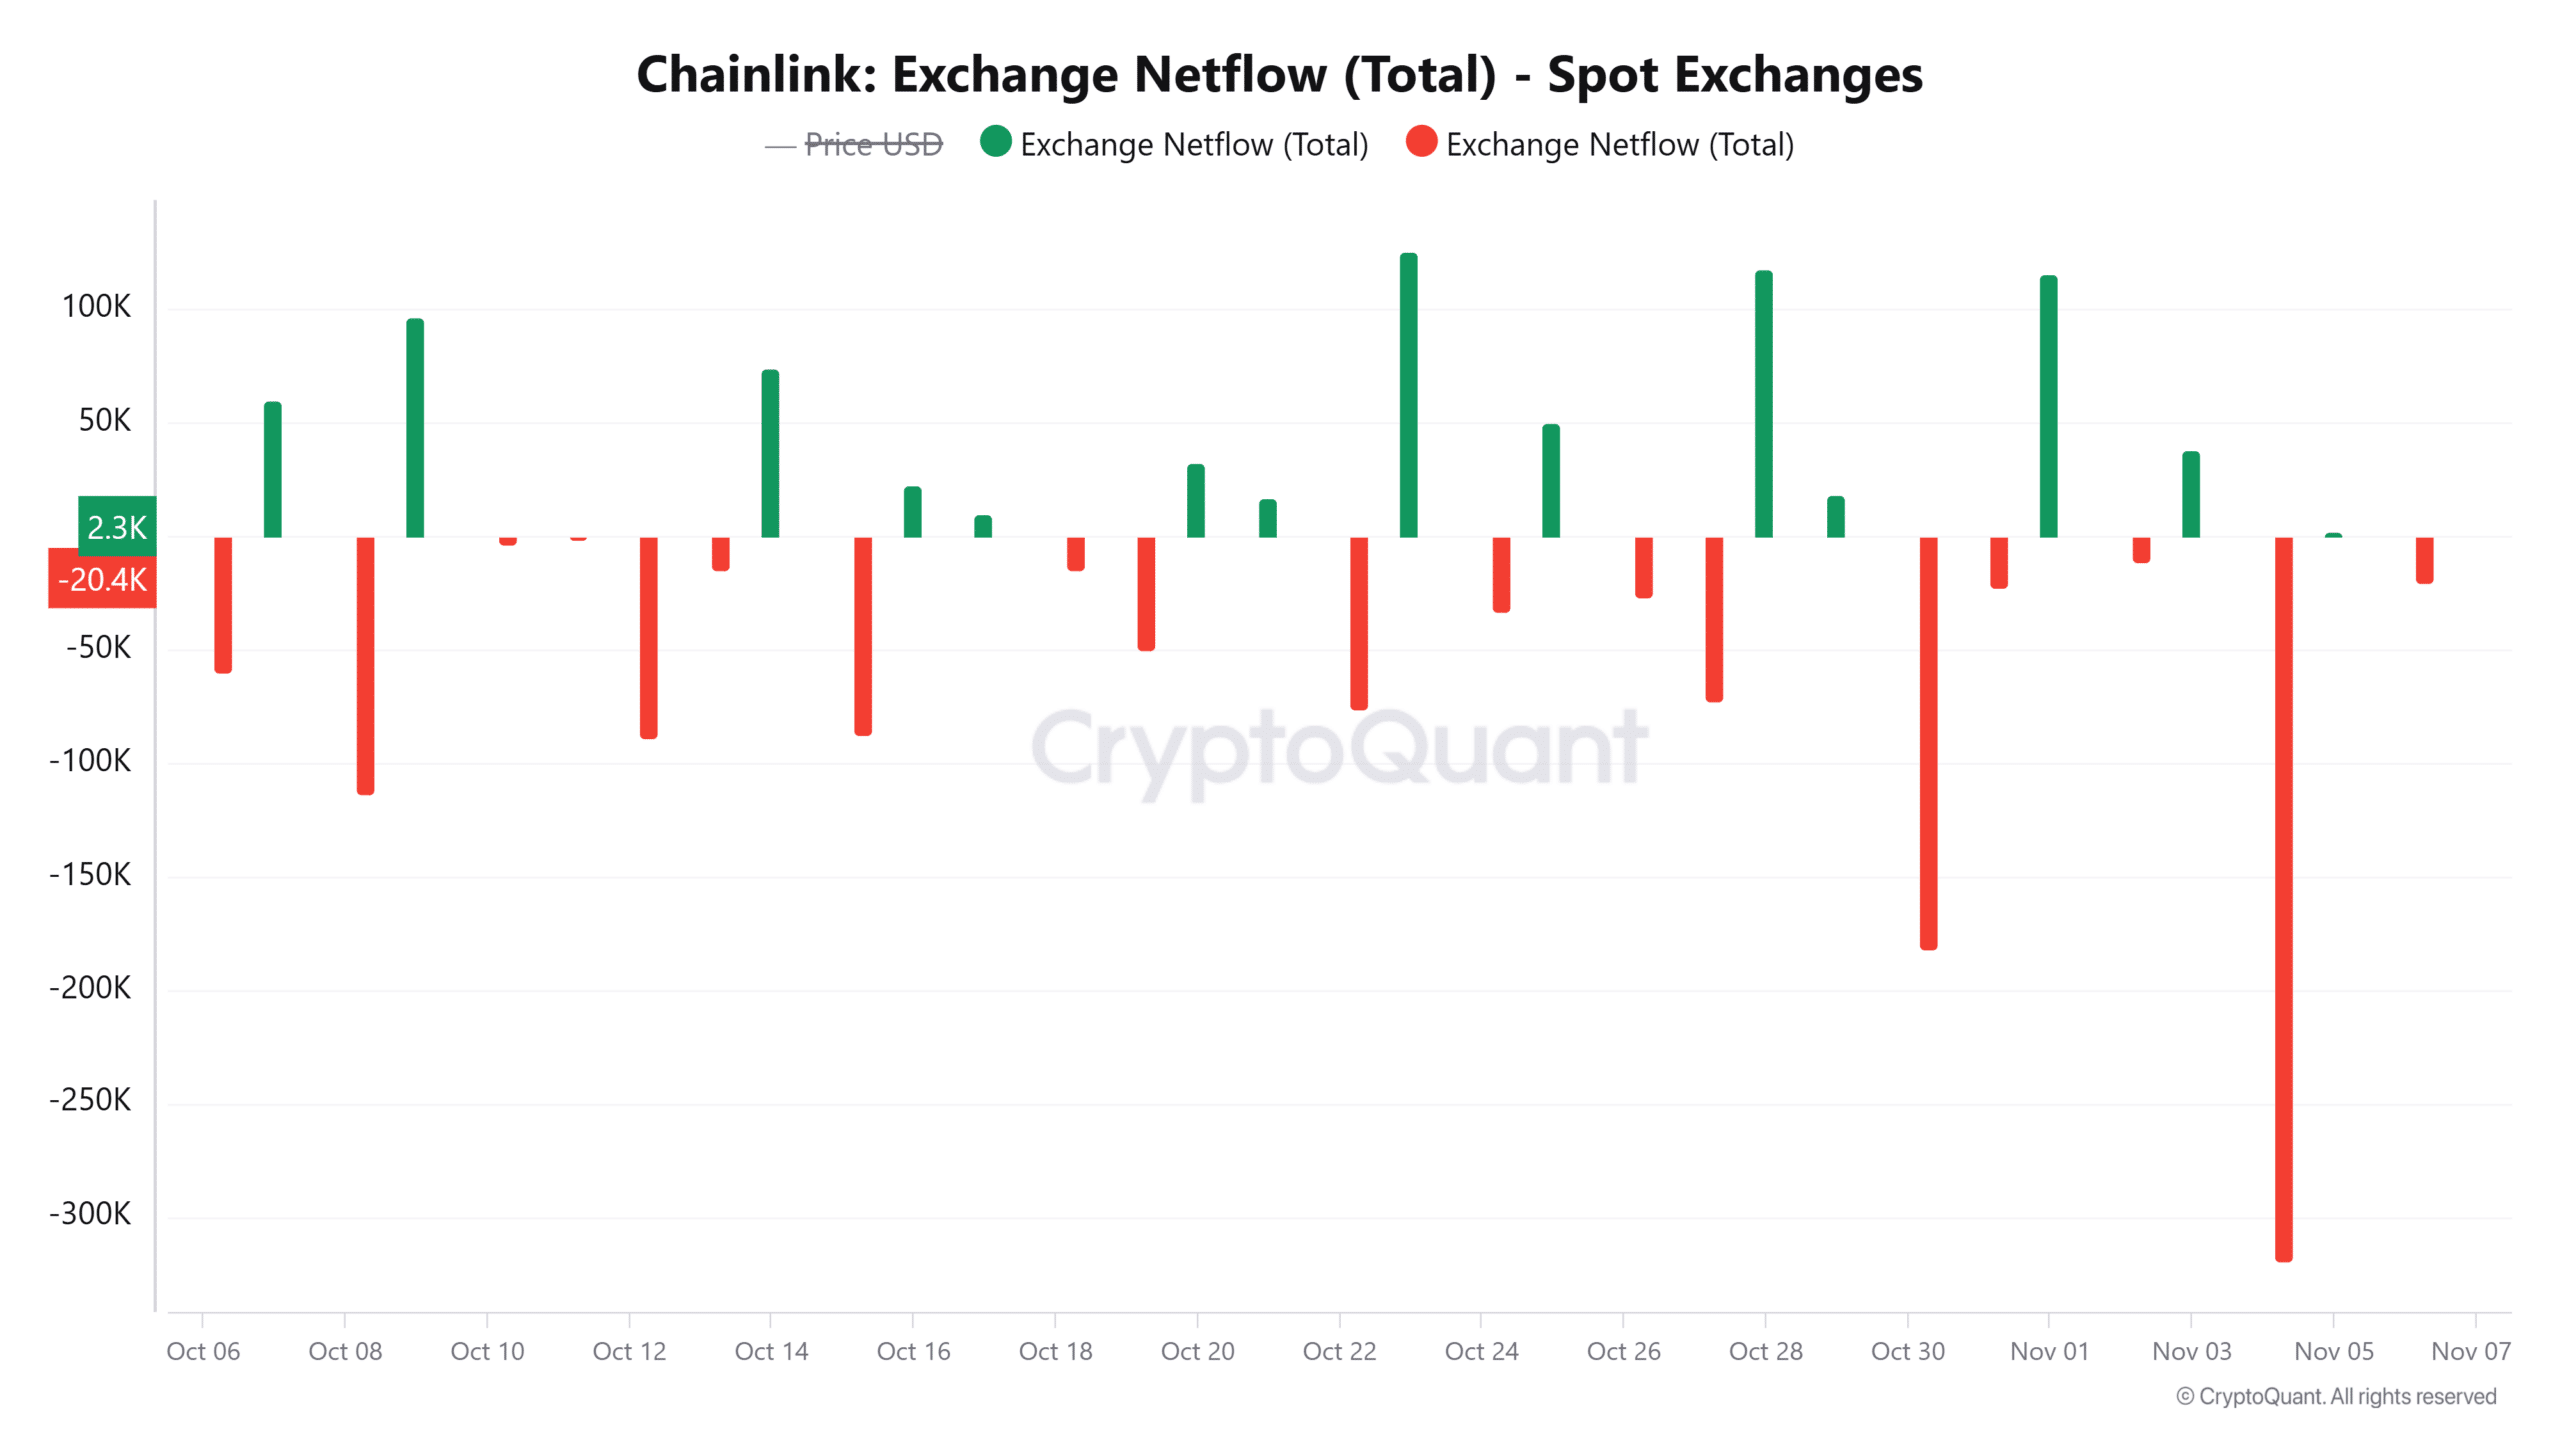
Data from CryptoQuant shows that over the past month, spot exchange netflows for LINK have been predominantly negative. In fact, on the 4th of November, LINK outflows spiked to a 30-day high.
This surge suggested an unwillingness by traders to sell their LINK tokens. If the sell-side pressure is easing, it positions LINK on the path toward a rebound.
Are buyers behind LINK’s rally?
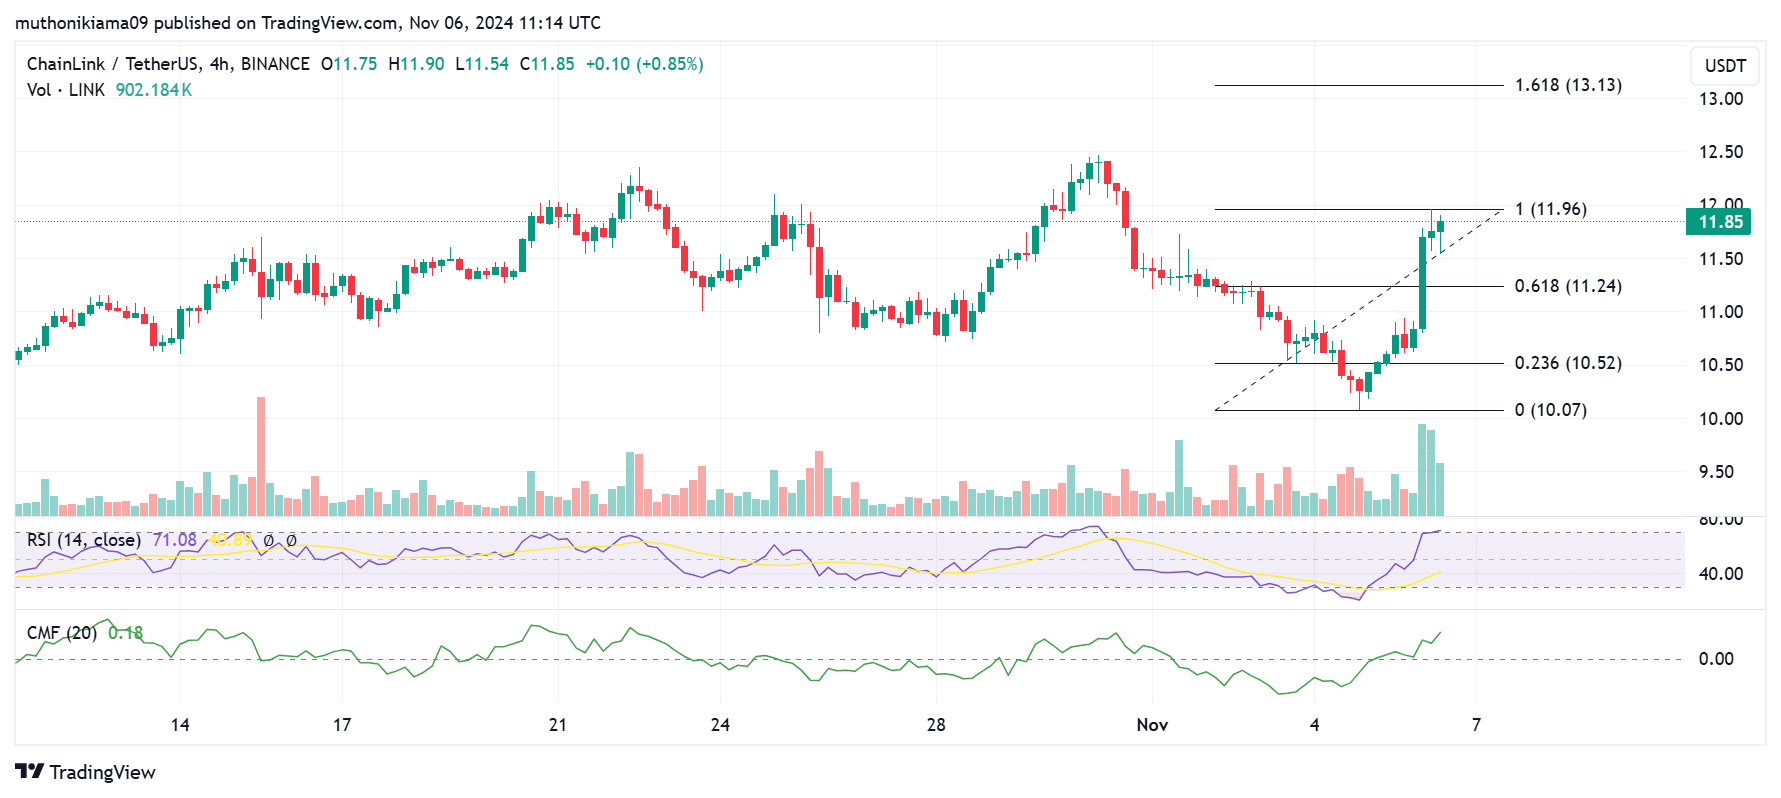
For LINK to make significant gains and break from bearish trends, it needs support from buyers. A look at the four-hour chart shows that buying pressure is gaining momentum.
The Relative Strength Index (RSI) had surged to a value of 71 showing that the momentum is bullish. The RSI recorded a sharp move north, indicating that buying activity was behind the recent uptrend.
The Chaikin Money Flow (CMF) also shows buying pressure after flipping positive and reaching a value of 0.17.
If this buying activity continues, the next target for LINK is the 1.618 Fibonacci level ($13.13).
The V-shaped recovery on the four-hour chart also shows a healthy bounce from the downtrend and rising confidence in LINK. This further supports the chances of a sustained uptrend.
Besides buyers, rising activity on the Chainlink blockchain could also be a catalyst for growth.
Chainlink blockchain usage on the rise
According to an X post by Santiment, Chainlink has emerged as the top Real World Asset (RWA) project by development activity. In just 30 days, development activity on the network has surged by more than 14,000%.
A similar rise is also seen in the number of active addresses on the blockchain. In just four days, daily active addresses on the network have increased from 1,930 to 2,750 at press time.
An increase in active addresses on a blockchain network usually shows that there is rising usage and engagement. It is also a bullish signal that could act as a precursor for price growth.
Open Interest spikes
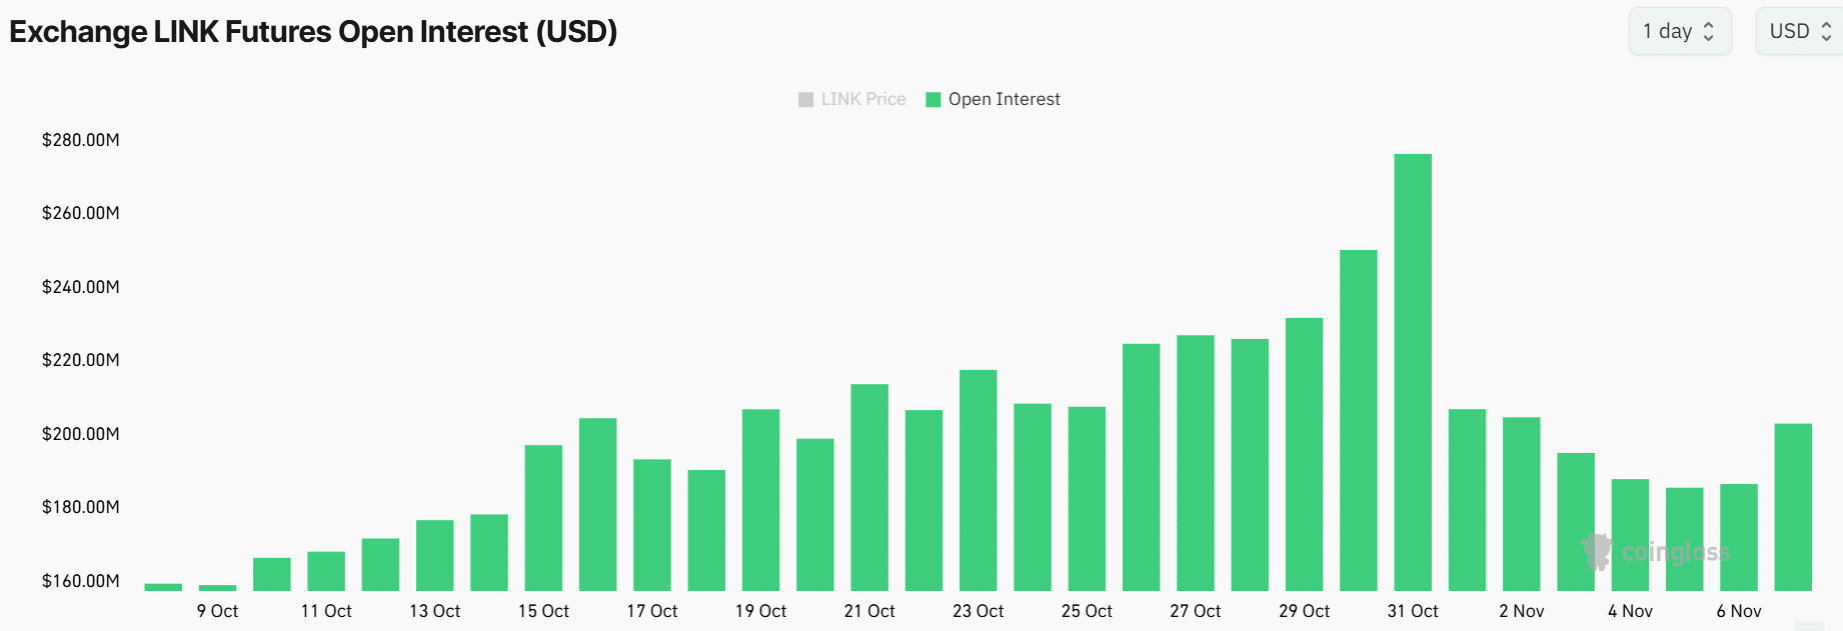
A look at derivatives data shows that speculative activity around LINK is on the rise again. After Open Interest dropped earlier this week, it since surged to $203M at press time.
Read Chainlink’s [LINK] Price Prediction 2024–2025
The rising Open Interest has coincided with a spike in Funding Rates to the highest level month-to-date. This shows that derivative traders are now opening long positions and betting on more gains for Chainlink.
The reducing selling pressure and rising interest from both spot and derivative traders could be the catalyst needed by LINK to propel towards new highs.


